Recently Experienced Tail Events Update – May ’20
Conventional financial theory and option pricing models implicitly assume normality, where deviations from average levels follow a bell shaped curve and tail events, as defined as moves larger than three standard deviations from the mean, are extremely rare. In reality, market fundamentals and commodity prices exhibit far greater variability, particularly during events such as the COVID-19 global pandemic. Examples of such deviations, measured by standard deviations, or sigmas, are outlined below. For perspective, 99.7% of all data points are expected to be contained within 3.0 sigmas of a normal distribution.
Crude Oil Prices
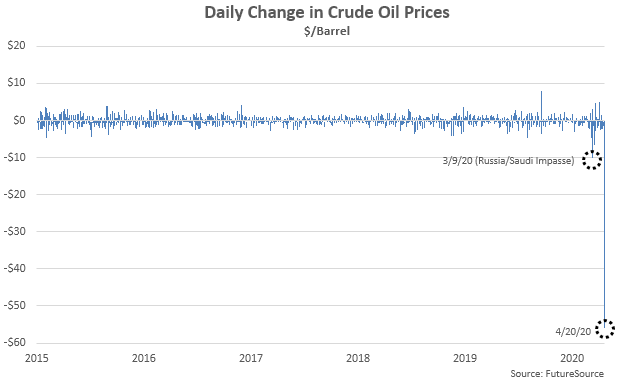
Crude oil prices declined sharply during early Mar ’20 following the Russia/Saudi impasse and then reached a previously inconceivable negative $37/barrel price level on Apr 20th as storage concerns mounted as first notice for May delivery approached. Crude oil prices have remained at sub-$20/barrel levels through the end of April.
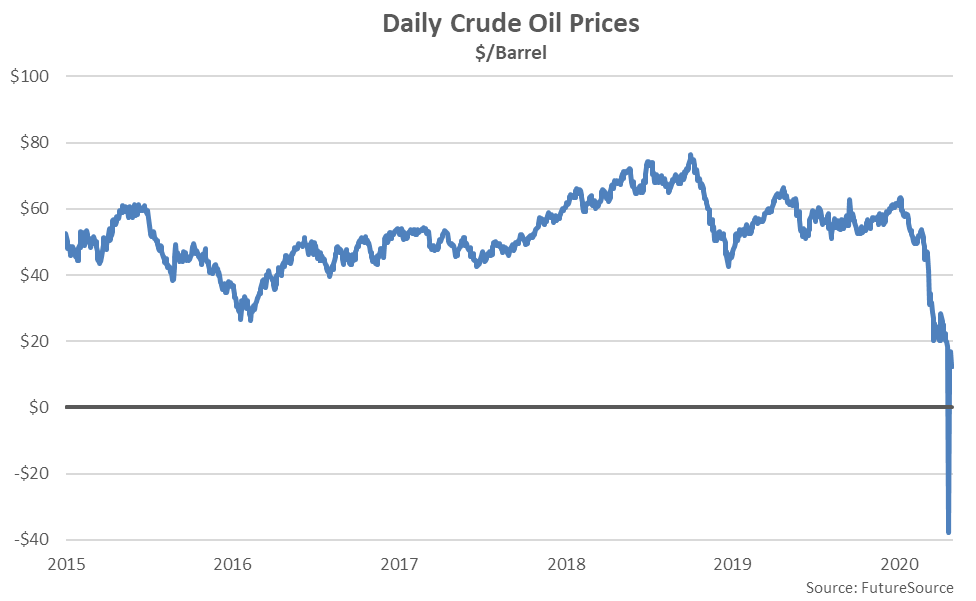 The decline in crude oil prices exhibited following the Russia/Saudi impasse was a 7.2 sigma event, while the Apr 20th decline was a 39.1 sigma event.
 Oil Rig Counts
Oil rig counts have followed crude oil prices lower, reaching a 47 month low level during the week ending May 1st. May 1st week ending oil rig counts finished 59.7% lower on a YOY basis and 63.4% below the three and a half year high level experienced during Nov ’18.
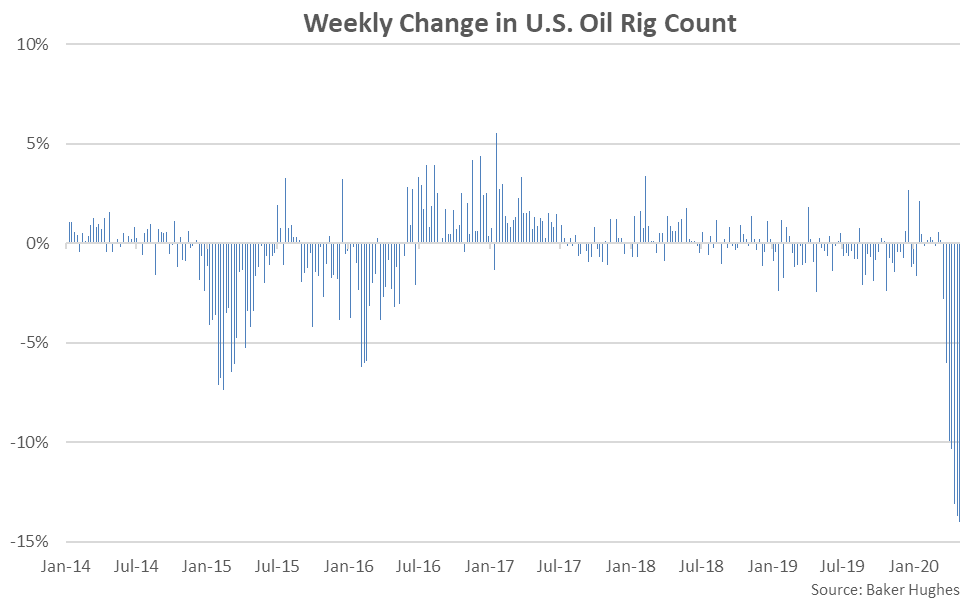
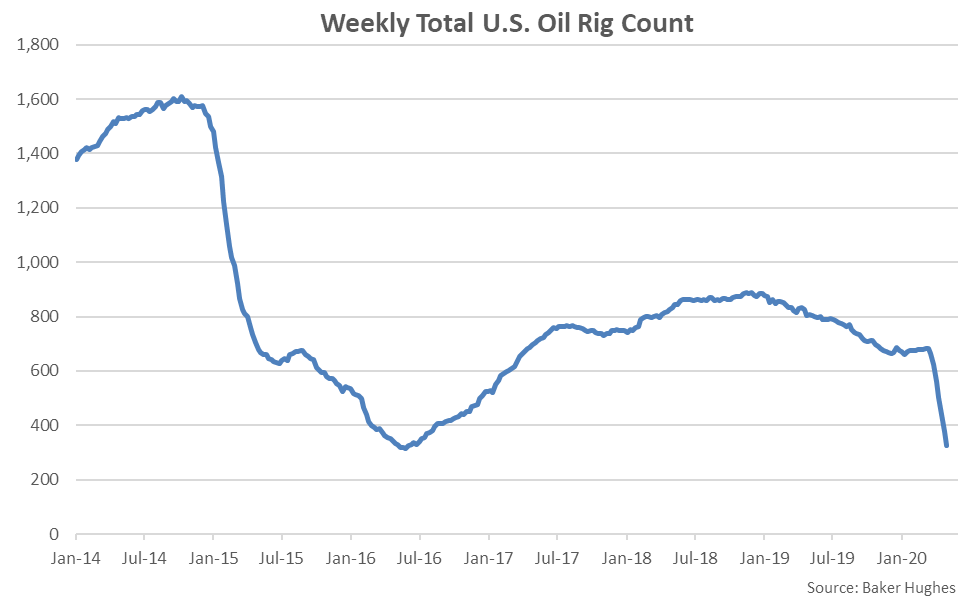 The May 1st weekly percentage decline in oil rig counts was the largest experienced throughout the past 14 years. The decline was a 4.3 sigma event when compared to historical figures compiled since 1987.
 Gasoline Sales
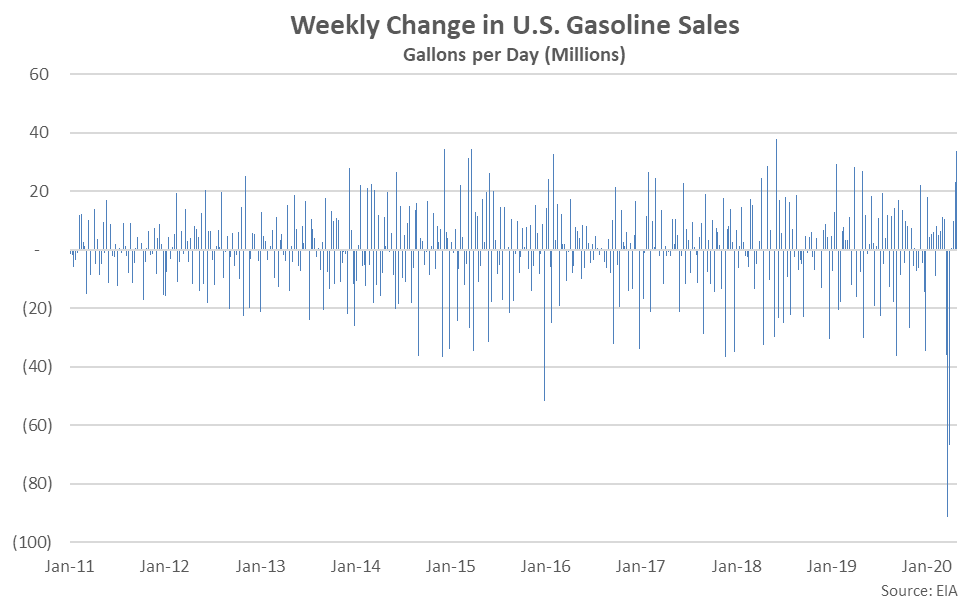
Weekly gasoline sales declined to a record low level during the week ending Apr 3rd, prior to rebounding slightly throughout more recent weeks.
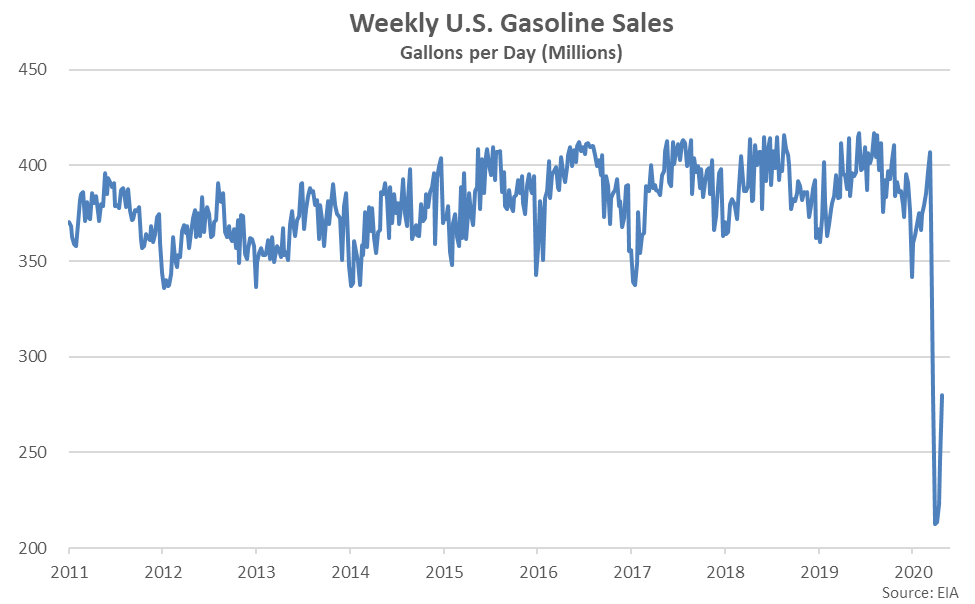 The Apr 3rd decline in gasoline sales was a 6.8 sigma event when compared to historical figures compiled since 2011.
 Ethanol Production
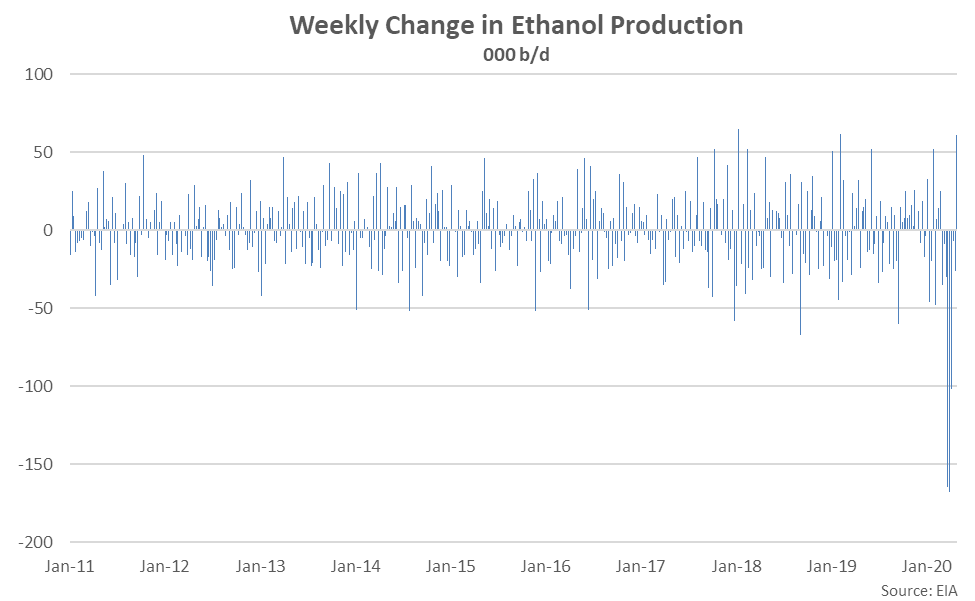
Ethanol run rates declined over eight consecutive weeks through the week ending Apr 24th, reaching the lowest figure on record, prior to rebounding slightly throughout the most recent week of data. Ethanol run rates declined by a total of 49.3% from the Jan ’20 average run rates.
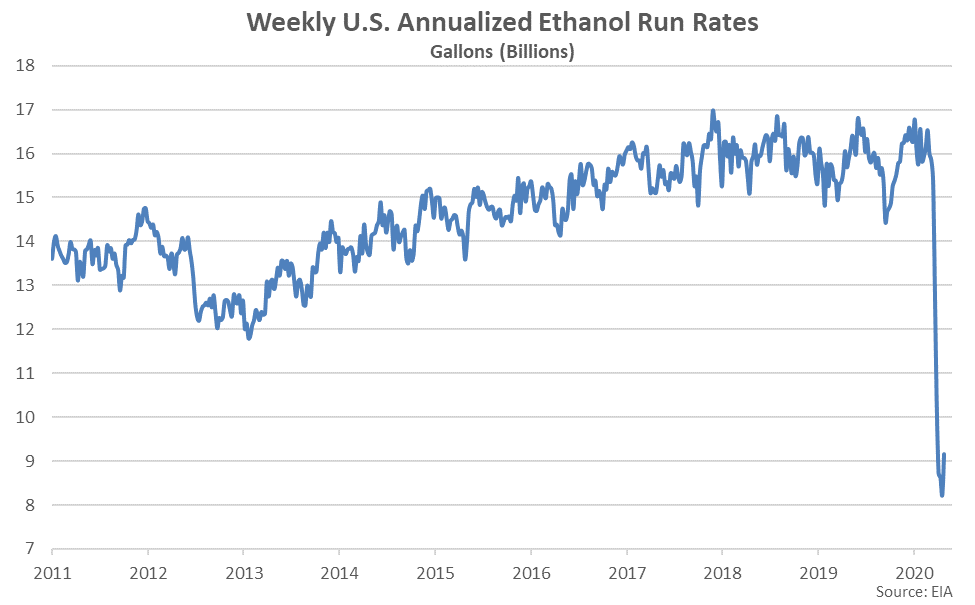 Declines in ethanol run rates experienced throughout the final week of March and first week of April were the largest on record. Weekly declines were 7.8-8.0 sigma events when compared to historical figures compiled since 2011.
 Ethanol Stocks
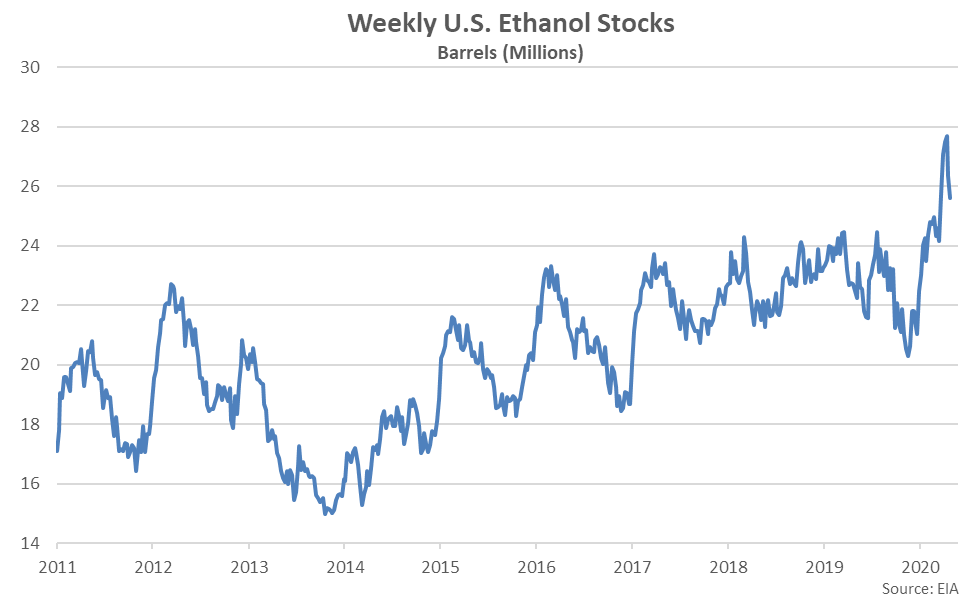
Ethanol stocks reached a record high level throughout the week ending Apr 17th, prior to declining throughout the two most recent weeks of data. Ethanol stocks accumulated despite the significantly reduced run rates as stay at home orders decimated gasoline sales.
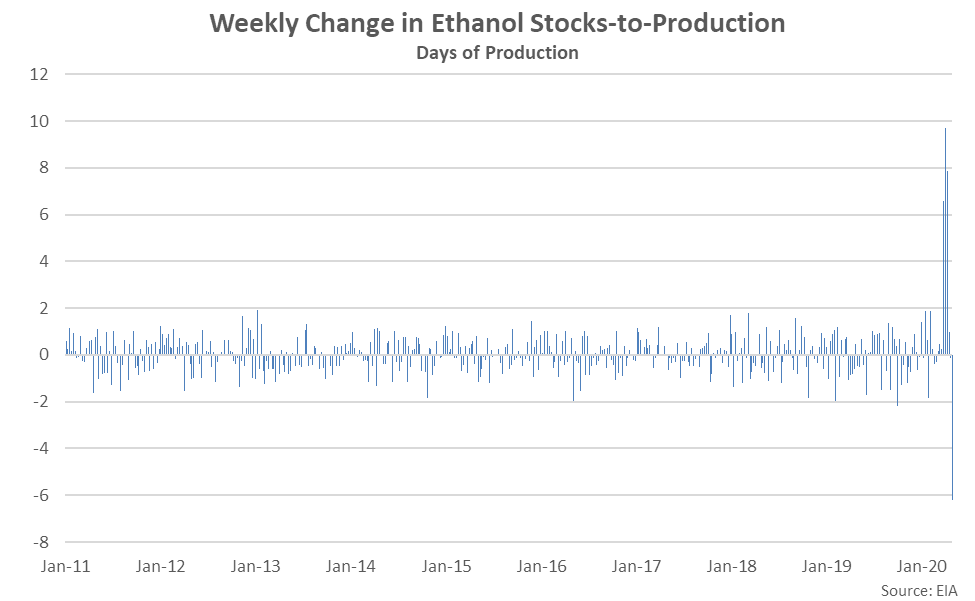
 The weekly builds in ethanol stocks were most significant throughout the final week of March and early weeks of April. On a stocks-to-production basis, the Apr 3rd weekly increase was a 12.6 sigma event.
 Milk Prices
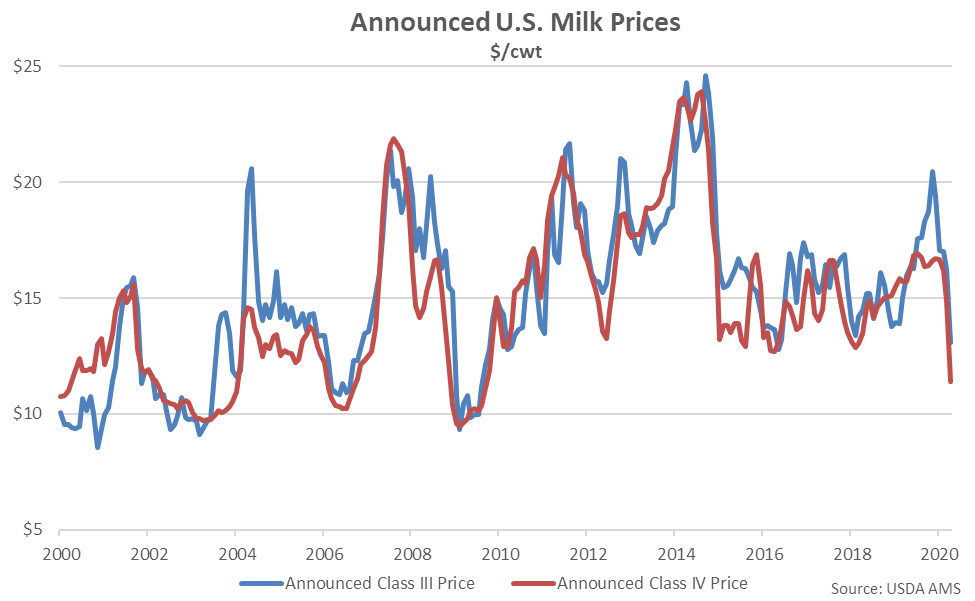
Dairy prices have also declined significantly throughout recent months as COVID-19 has decimated food service demand and trade between countries. Dairy product spot prices declined by 27-37% in total from March – April, while Class III and Class IV announced milk prices declined to ten and 11 year seasonal low levels, respectively.
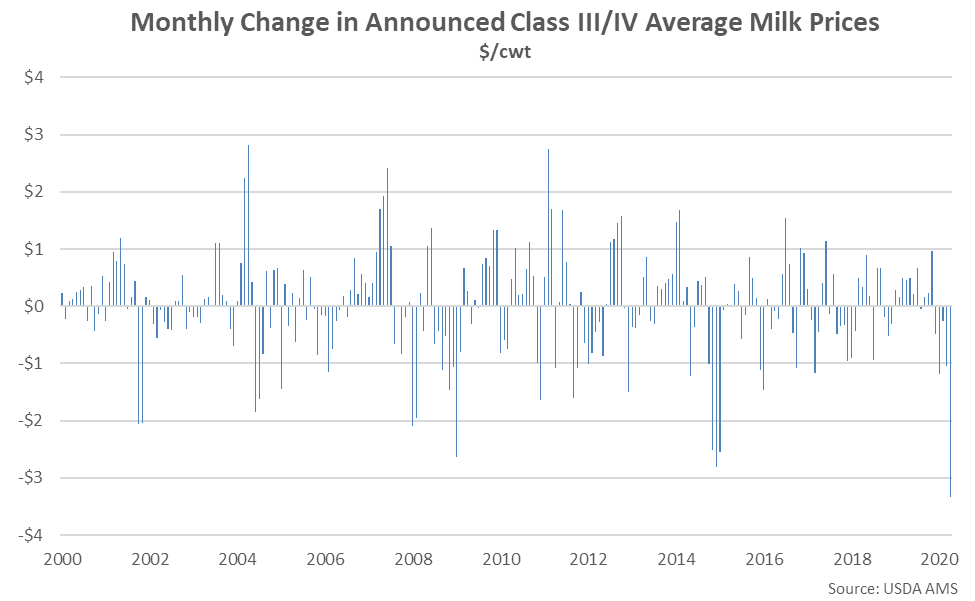
 The Apr ’20 monthly decline in average announced Class III and Class IV milk prices was the largest on record. The decline was a 3.7 sigma event when compared to historical figures compiled since 1995.
 Dumped Milk
Dumped milk figures are currently only available through Mar ’20, but anecdotal reports indicate dumped volumes are expected to reach record high levels throughout the month of April. Mar ’20 dumped milk figures reached a record high seasonal level for the month of March.
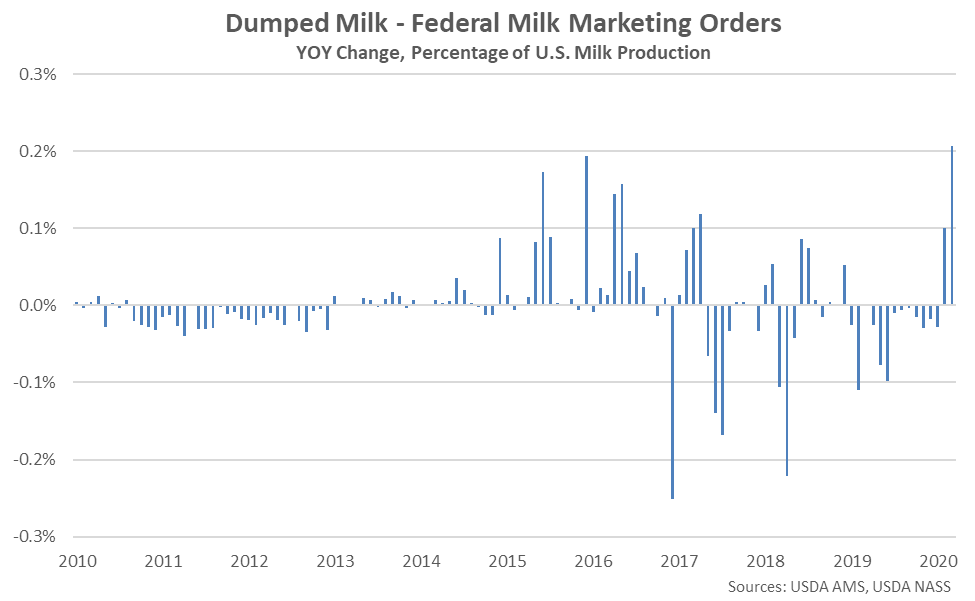
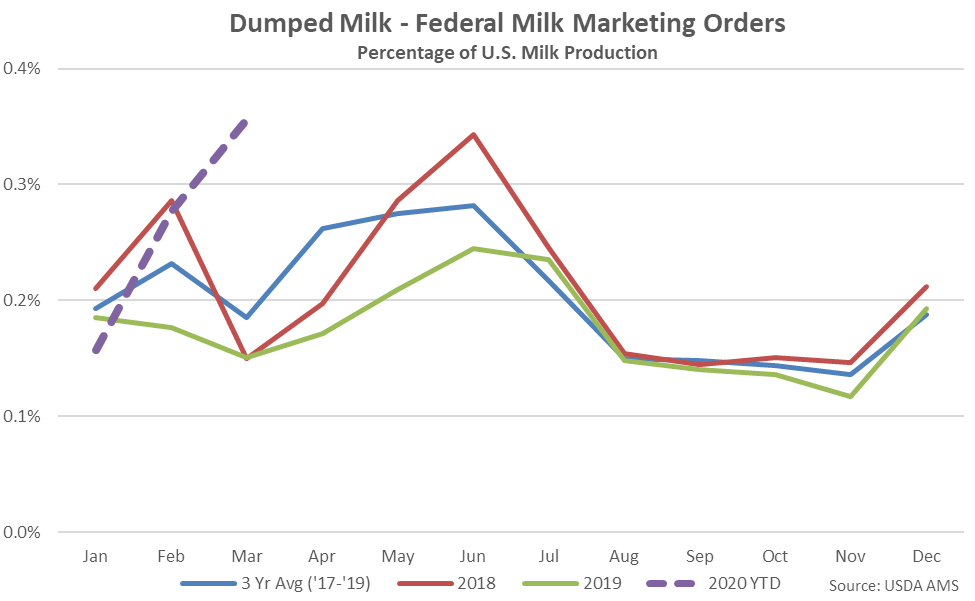 On a percentage of milk production basis, the Mar ’20 figure reached a 35 month high level. The YOY increase in dumped milk on a percentage of milk production basis was a 4.6 sigma event when compared to historical figures compiled since 2000.
 Cattle & Hog Slaughter
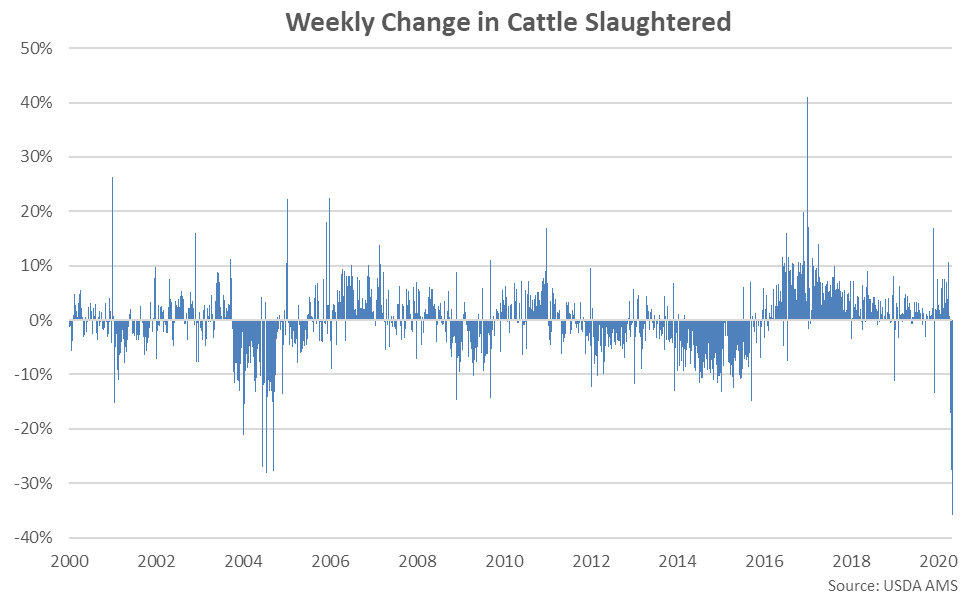
Weekly cattle and hog slaughter rates have declined to record low seasonal levels over recent weeks following the closure of several packing plants stemming from worker illnesses related to COVID-19. May 2nd week ending cattle slaughter figures are expected to decline to levels just over 50% of maximum historical slaughter capacity based on currently available daily figures.
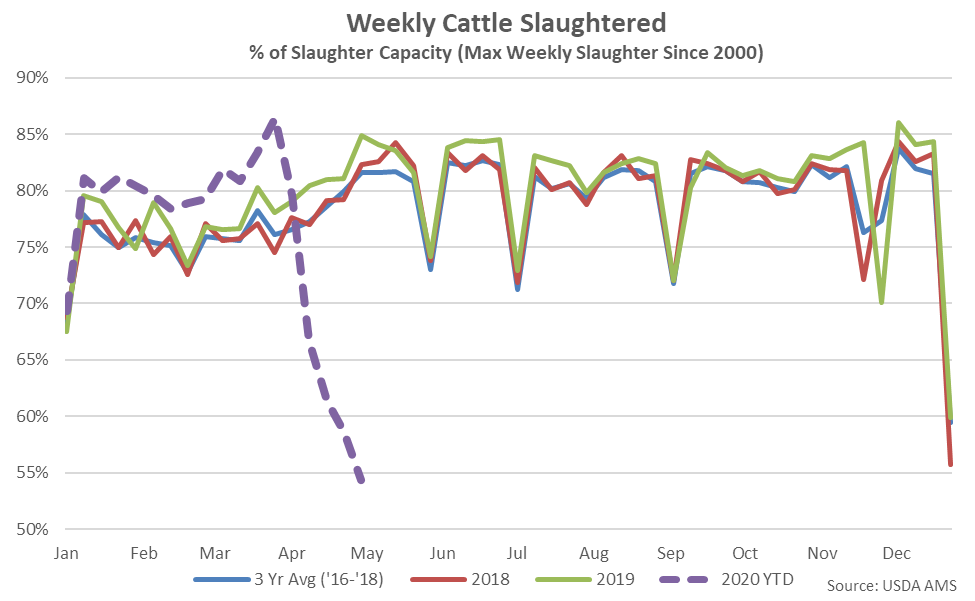 The May 2nd weekly decline in cattle slaughtered was the largest on record on a percentage basis and a 6.0 sigma event when compared to historical values compiled since 2000.
 May 2nd week ending hog slaughter figures are expected to decline to levels just over 55% of maximum historical slaughter capacity based on currently available daily figures, also reaching a record low seasonal level.
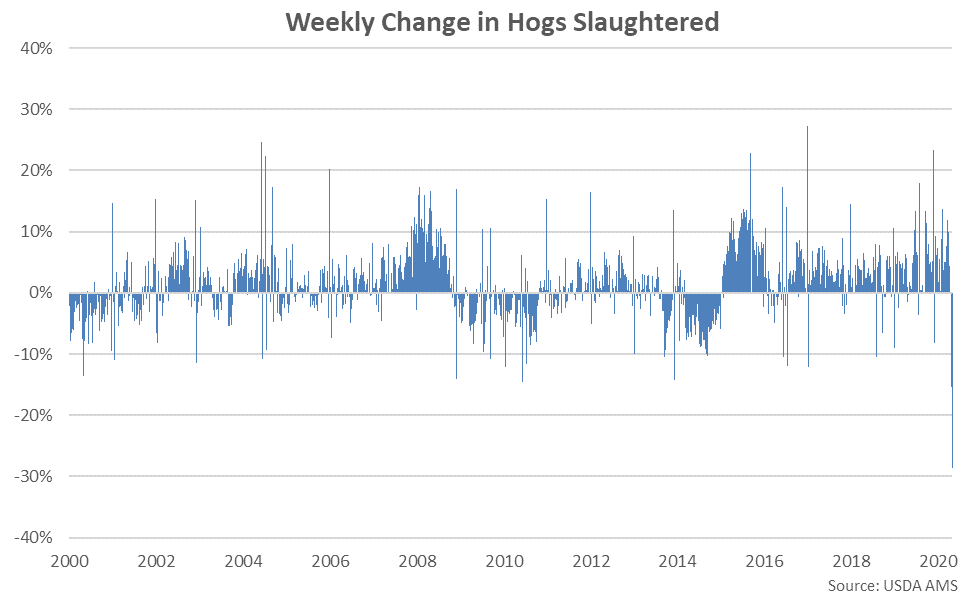
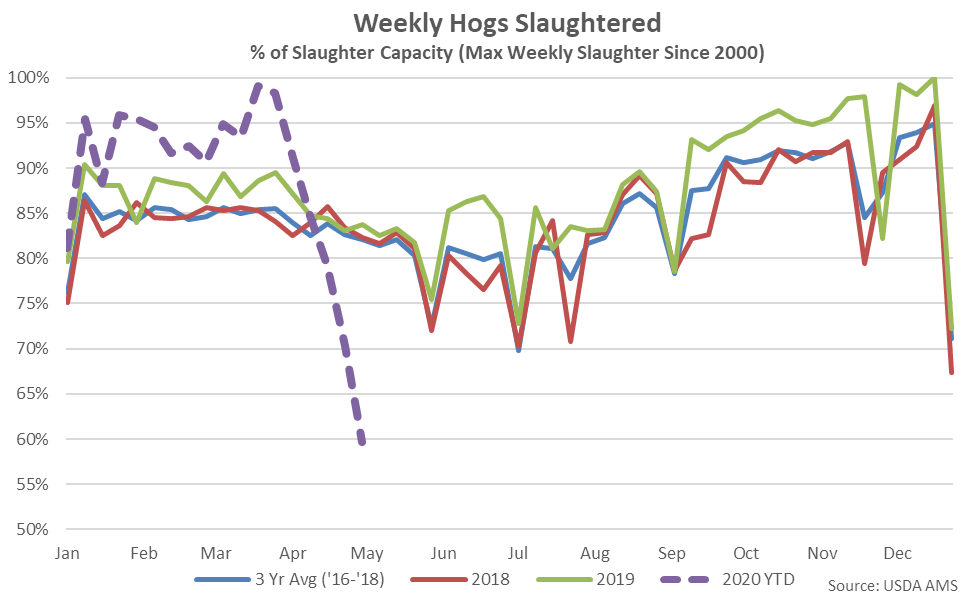 The May 2nd weekly decline in hogs slaughtered was the largest on record on a percentage basis and a 5.7 sigma event when compared to historical values compiled since 2000.
 Boxed Beef & Pork Cutout Values
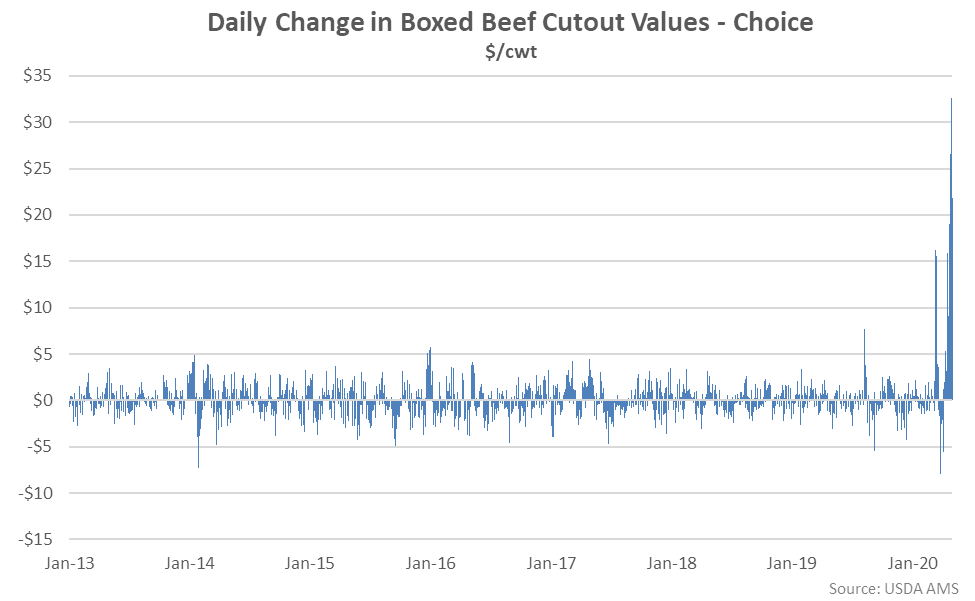
Recently experienced disruptions in the packing sector have resulted in sharp increases in both boxed beef cutout and pork cutout values. Boxed beef cutout values increased to a record high level during early May ’20, over doubling the levels experienced during early April.
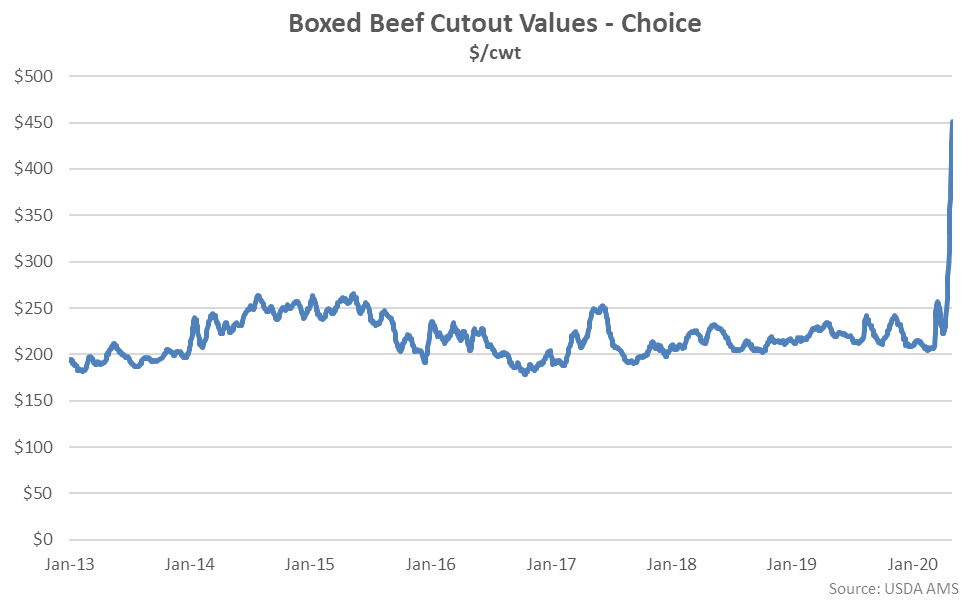 The Apr 29th increase in boxed beef cutout values was a 14.6 sigma event when compared to historical values compiled since 2004.
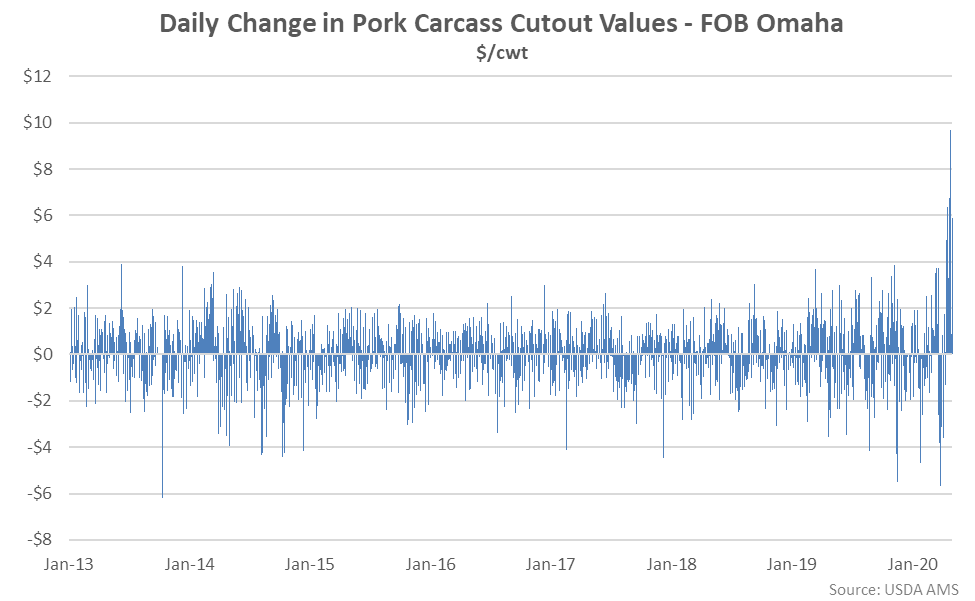
 Pork cutout values increased to a five year high level during early May ’20, over doubling the levels experienced during early April.
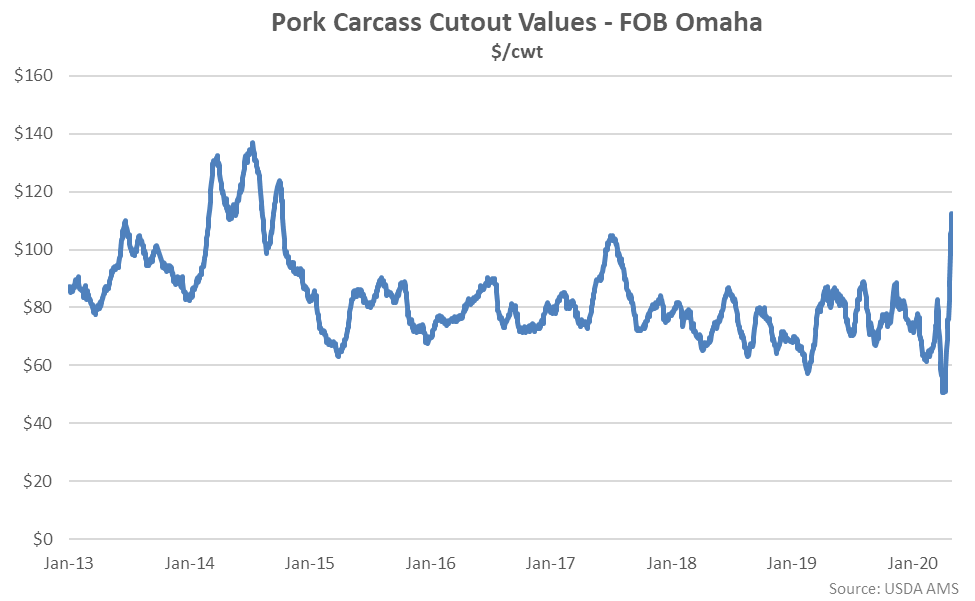 The Apr 30th increase in pork cutout values was a 7.4 sigma event when compared to historical values compiled since 2013.
 Federal Reserve Balance Sheet
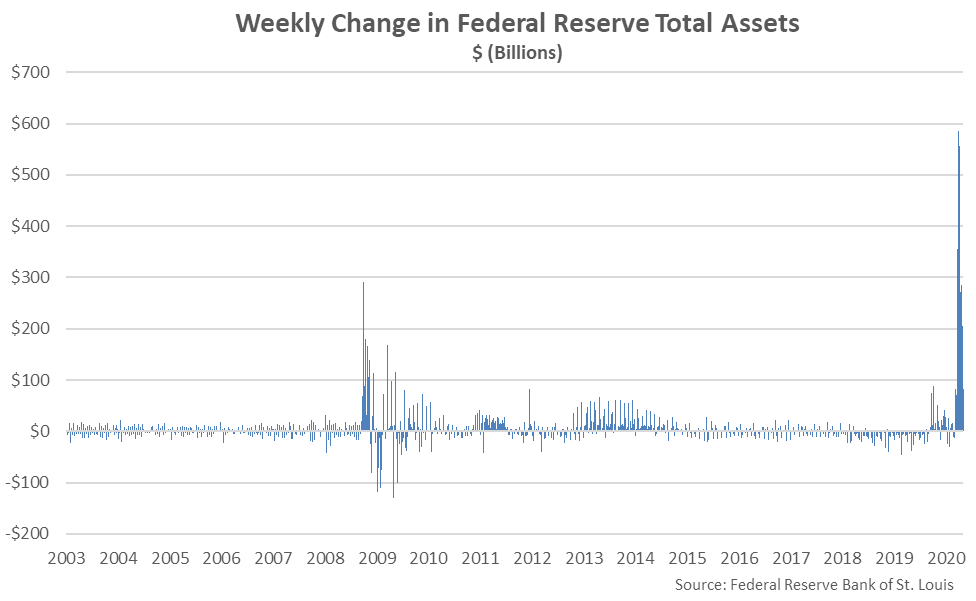
COVID-19 has also wreaked havoc on several important macro indicators. Federal Reserve assets have increased by 59.5% since the beginning of the year, reaching a record high level. Federal Reserve assets have increase throughout nine consecutive weeks through the week ending Apr 29th.
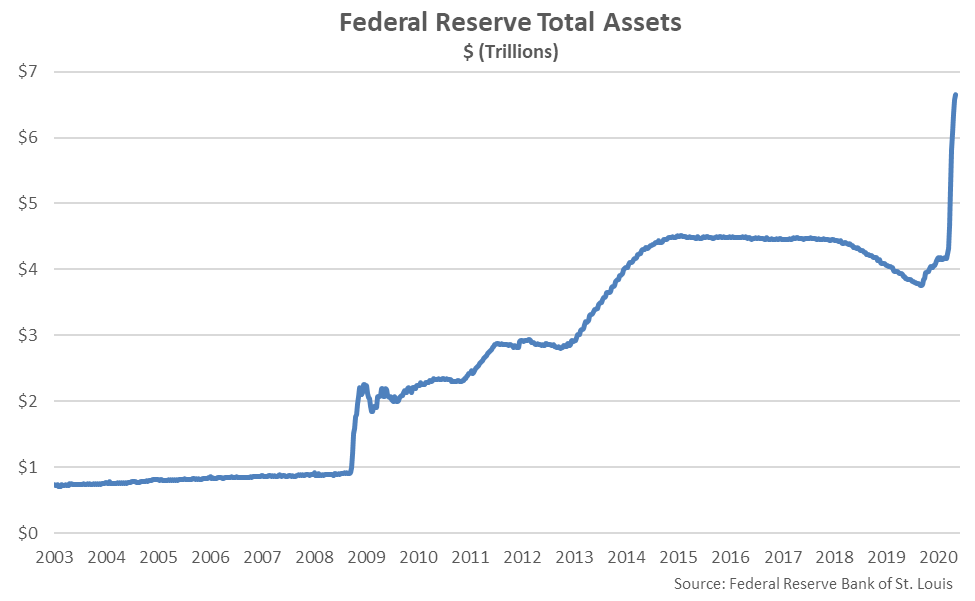 The Mar 25th weekly increase in Federal Reserve assets was a 20.4 sigma event when compared to historical figures compiled since 2003, far outpacing the builds in assets acquired following the Financial Crisis of 2007-2008.
 Weekly Jobless Claims
Initial weekly jobless claims reached a record high level during the week ending Mar 21st and remained at elevated levels over more recent weeks. In total, there have been over 33 million jobless claims filed over the past seven weeks.
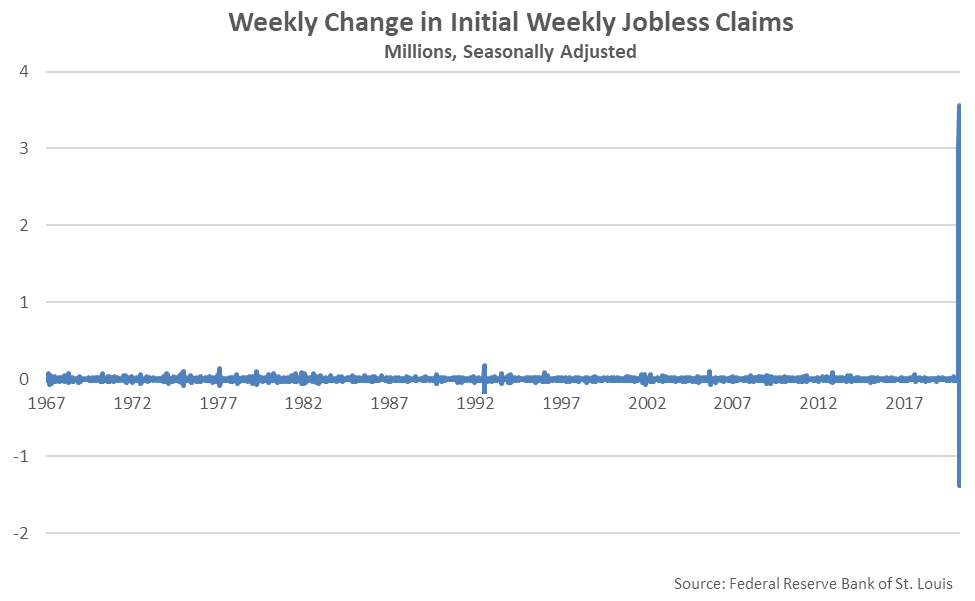
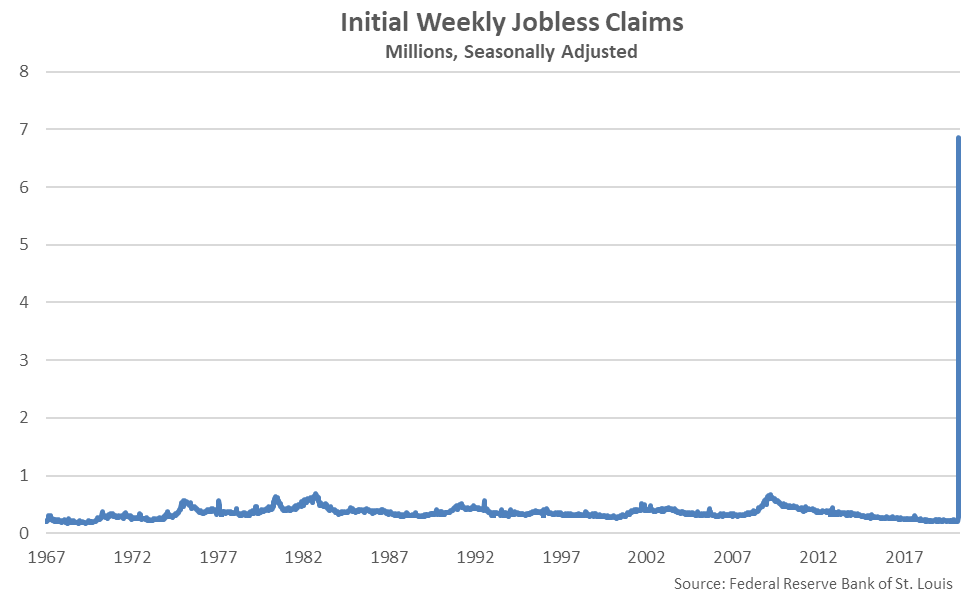 The Mar 21st increase in jobless claims was a 169.2 sigma event when compared to historical figures compiled since 1967. The weekly increase in jobless claims was over 17 times larger than the previous record high increase in jobless claims experienced during Jul ’92.
 Monthly Nonfarm Payroll
Monthly nonfarm payroll figures declined to a nine year low level during Apr ’20, losing an unprecedented 20.5 million jobs as the unemployment rate soared to 14.7%.
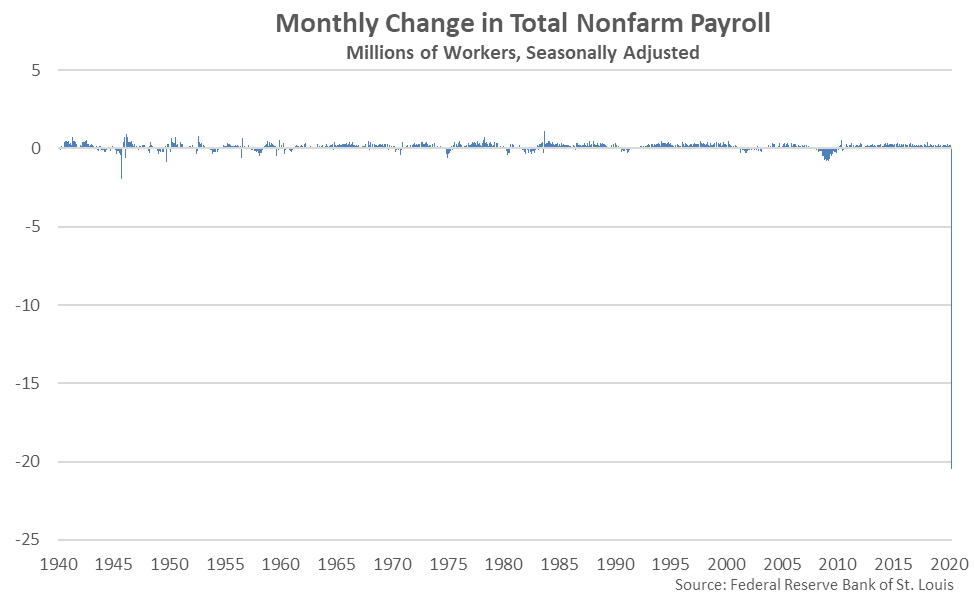
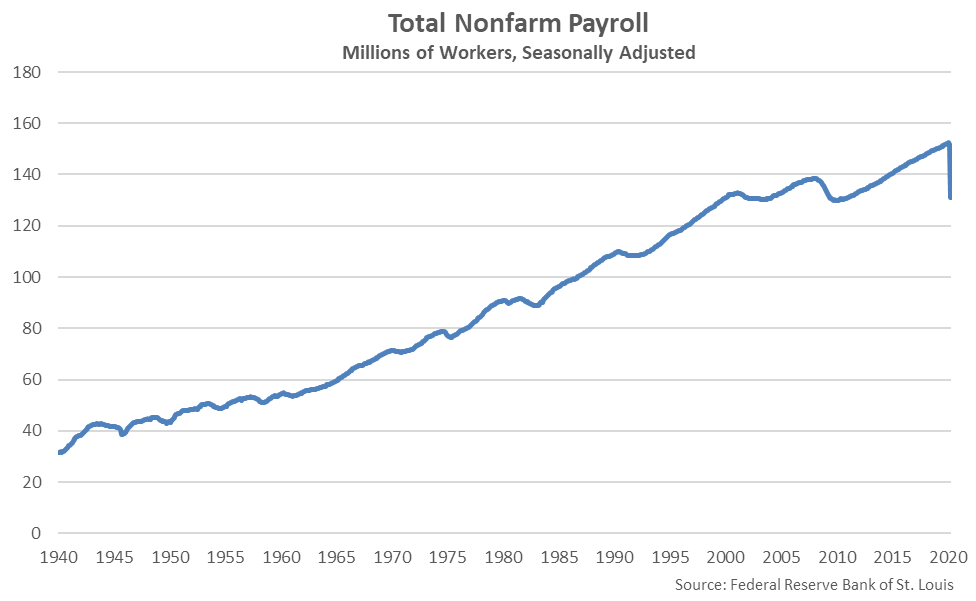 The Apr ’20 month-over-month decline in nonfarm payroll figures was by far the largest experienced on record, finishing at over ten times as large as the previous record decline experienced during Sep ’45 after American soldiers returned home from World War II. The decline was a 91.5 sigma event when compared to historical figures compiled since 1939.
 Summary – Sigma Comparison
To put the recent deviations in market prices and fundamentals in perspective, the following chart compares the recently experienced sigmas to the expected frequencies of such events occurring within a normal distribution. Because of the exponential tails of the normal distribution, odds of larger deviations decrease very quickly. The 3.7 sigma decline in milk prices should occur once in every 4,600 data points whereas the 7.4 sigma increase in pork cutout values should occur once in every 7.3 trillion data points. The odds of occurrence of sigmas much larger lose meaning altogether, approaching an impossibility.
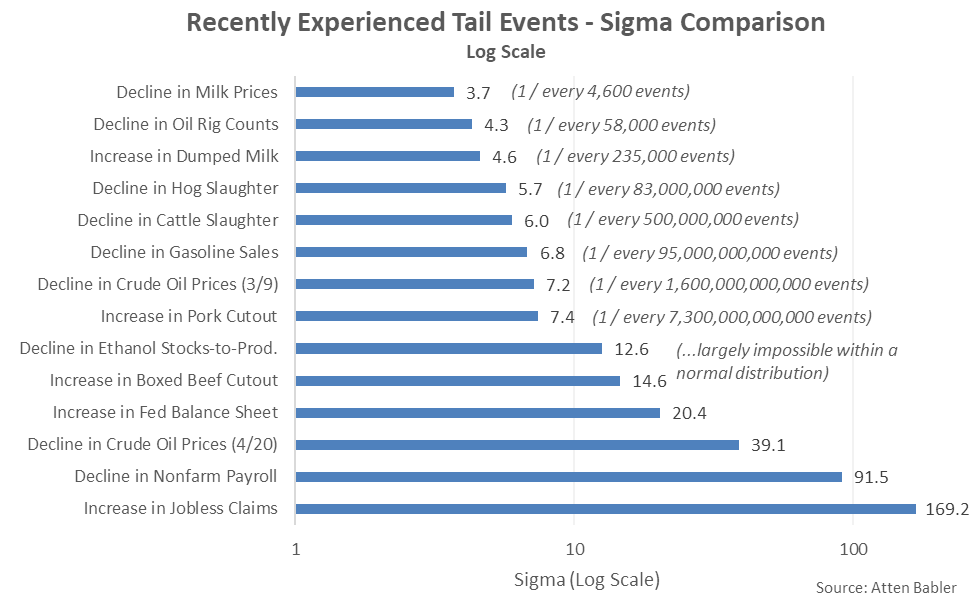 Clearly, commodity markets exhibit deviations far exceeding those captured within the implicit assumption of normality. As recently experienced within crude oil markets, one cannot even assume prices are bound to the downside at zero!
As Murphy’s Law says, “anything that can go wrong will go wrong” – from the perspective of a commodity market participant with price risk, the takeaway is one must always protect their downside and be long volatility, if at all possible. Having a plan to consistently manage price risk is crucial when dealing in markets with such wild fluctuations, as they can occur at any time and without warning.
 The decline in crude oil prices exhibited following the Russia/Saudi impasse was a 7.2 sigma event, while the Apr 20th decline was a 39.1 sigma event.
 Oil Rig Counts
Oil rig counts have followed crude oil prices lower, reaching a 47 month low level during the week ending May 1st. May 1st week ending oil rig counts finished 59.7% lower on a YOY basis and 63.4% below the three and a half year high level experienced during Nov ’18.
 The May 1st weekly percentage decline in oil rig counts was the largest experienced throughout the past 14 years. The decline was a 4.3 sigma event when compared to historical figures compiled since 1987.
 Gasoline Sales
Weekly gasoline sales declined to a record low level during the week ending Apr 3rd, prior to rebounding slightly throughout more recent weeks.
 The Apr 3rd decline in gasoline sales was a 6.8 sigma event when compared to historical figures compiled since 2011.
 Ethanol Production
Ethanol run rates declined over eight consecutive weeks through the week ending Apr 24th, reaching the lowest figure on record, prior to rebounding slightly throughout the most recent week of data. Ethanol run rates declined by a total of 49.3% from the Jan ’20 average run rates.
 Declines in ethanol run rates experienced throughout the final week of March and first week of April were the largest on record. Weekly declines were 7.8-8.0 sigma events when compared to historical figures compiled since 2011.
 Ethanol Stocks
Ethanol stocks reached a record high level throughout the week ending Apr 17th, prior to declining throughout the two most recent weeks of data. Ethanol stocks accumulated despite the significantly reduced run rates as stay at home orders decimated gasoline sales.
 The weekly builds in ethanol stocks were most significant throughout the final week of March and early weeks of April. On a stocks-to-production basis, the Apr 3rd weekly increase was a 12.6 sigma event.
 Milk Prices
Dairy prices have also declined significantly throughout recent months as COVID-19 has decimated food service demand and trade between countries. Dairy product spot prices declined by 27-37% in total from March – April, while Class III and Class IV announced milk prices declined to ten and 11 year seasonal low levels, respectively.
 The Apr ’20 monthly decline in average announced Class III and Class IV milk prices was the largest on record. The decline was a 3.7 sigma event when compared to historical figures compiled since 1995.
 Dumped Milk
Dumped milk figures are currently only available through Mar ’20, but anecdotal reports indicate dumped volumes are expected to reach record high levels throughout the month of April. Mar ’20 dumped milk figures reached a record high seasonal level for the month of March.
 On a percentage of milk production basis, the Mar ’20 figure reached a 35 month high level. The YOY increase in dumped milk on a percentage of milk production basis was a 4.6 sigma event when compared to historical figures compiled since 2000.
 Cattle & Hog Slaughter
Weekly cattle and hog slaughter rates have declined to record low seasonal levels over recent weeks following the closure of several packing plants stemming from worker illnesses related to COVID-19. May 2nd week ending cattle slaughter figures are expected to decline to levels just over 50% of maximum historical slaughter capacity based on currently available daily figures.
 The May 2nd weekly decline in cattle slaughtered was the largest on record on a percentage basis and a 6.0 sigma event when compared to historical values compiled since 2000.
 May 2nd week ending hog slaughter figures are expected to decline to levels just over 55% of maximum historical slaughter capacity based on currently available daily figures, also reaching a record low seasonal level.
 The May 2nd weekly decline in hogs slaughtered was the largest on record on a percentage basis and a 5.7 sigma event when compared to historical values compiled since 2000.
 Boxed Beef & Pork Cutout Values
Recently experienced disruptions in the packing sector have resulted in sharp increases in both boxed beef cutout and pork cutout values. Boxed beef cutout values increased to a record high level during early May ’20, over doubling the levels experienced during early April.
 The Apr 29th increase in boxed beef cutout values was a 14.6 sigma event when compared to historical values compiled since 2004.
 Pork cutout values increased to a five year high level during early May ’20, over doubling the levels experienced during early April.
 The Apr 30th increase in pork cutout values was a 7.4 sigma event when compared to historical values compiled since 2013.
 Federal Reserve Balance Sheet
COVID-19 has also wreaked havoc on several important macro indicators. Federal Reserve assets have increased by 59.5% since the beginning of the year, reaching a record high level. Federal Reserve assets have increase throughout nine consecutive weeks through the week ending Apr 29th.
 The Mar 25th weekly increase in Federal Reserve assets was a 20.4 sigma event when compared to historical figures compiled since 2003, far outpacing the builds in assets acquired following the Financial Crisis of 2007-2008.
 Weekly Jobless Claims
Initial weekly jobless claims reached a record high level during the week ending Mar 21st and remained at elevated levels over more recent weeks. In total, there have been over 33 million jobless claims filed over the past seven weeks.
 The Mar 21st increase in jobless claims was a 169.2 sigma event when compared to historical figures compiled since 1967. The weekly increase in jobless claims was over 17 times larger than the previous record high increase in jobless claims experienced during Jul ’92.
 Monthly Nonfarm Payroll
Monthly nonfarm payroll figures declined to a nine year low level during Apr ’20, losing an unprecedented 20.5 million jobs as the unemployment rate soared to 14.7%.
 The Apr ’20 month-over-month decline in nonfarm payroll figures was by far the largest experienced on record, finishing at over ten times as large as the previous record decline experienced during Sep ’45 after American soldiers returned home from World War II. The decline was a 91.5 sigma event when compared to historical figures compiled since 1939.
 Summary – Sigma Comparison
To put the recent deviations in market prices and fundamentals in perspective, the following chart compares the recently experienced sigmas to the expected frequencies of such events occurring within a normal distribution. Because of the exponential tails of the normal distribution, odds of larger deviations decrease very quickly. The 3.7 sigma decline in milk prices should occur once in every 4,600 data points whereas the 7.4 sigma increase in pork cutout values should occur once in every 7.3 trillion data points. The odds of occurrence of sigmas much larger lose meaning altogether, approaching an impossibility.
 Clearly, commodity markets exhibit deviations far exceeding those captured within the implicit assumption of normality. As recently experienced within crude oil markets, one cannot even assume prices are bound to the downside at zero!
As Murphy’s Law says, “anything that can go wrong will go wrong” – from the perspective of a commodity market participant with price risk, the takeaway is one must always protect their downside and be long volatility, if at all possible. Having a plan to consistently manage price risk is crucial when dealing in markets with such wild fluctuations, as they can occur at any time and without warning.