Natural Gas Fundamental Update – Mar ’21
Executive Summary
Natural gas fundamental data including gross withdrawals, the well situation, domestic consumption, exports and inventories have been updated through the end of 2020. Updated fundamental data is provided below, along with charts on the recently experienced record high spot prices. Highlights include:
- Moderate declines in both natural gas gross withdrawals and domestic consumption levels were exhibited throughout 2020. 2020 annual gross withdrawals declined 0.8% on a YOY basis while domestic consumption levels finished 2.3% below previous year figures. More recent data shows natural gas rigs continuing to rebound from the record low levels experienced throughout the summer of 2020.
- Liquefied natural gas export volumes reached a record high annual level for the fifth consecutive year throughout 2020, finishing 31% above previous year figures. Natural gas underground storage levels for the lower 48 states reached record high seasonal levels throughout the months of Aug ’20 – Oct ’20 but have been drawn down over more recent weeks of data, returning to below ten year average seasonal levels throughout the final two weeks of Feb ’21.
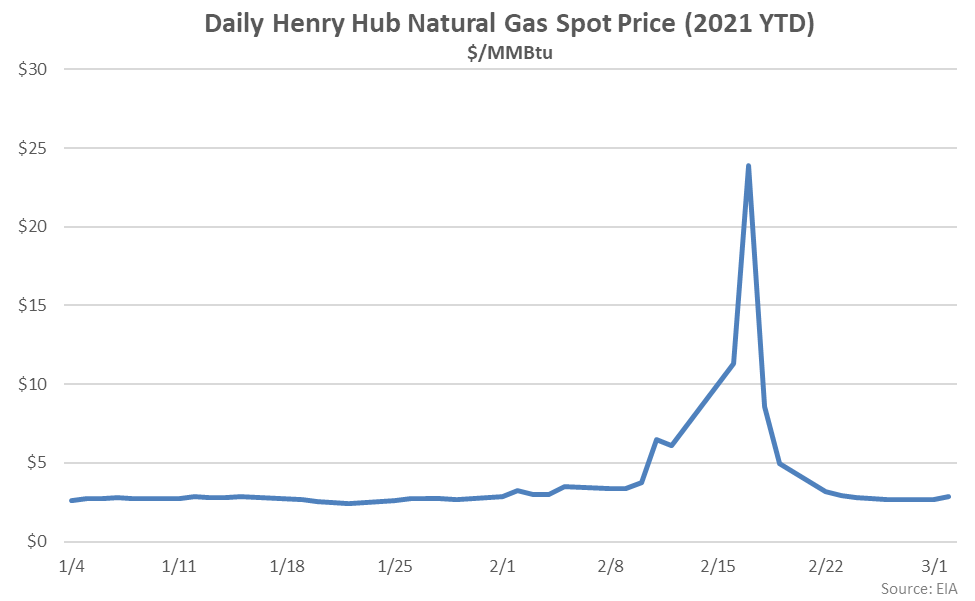
- Recent exceptionally cold weather experienced across most of the lower 48 states resulted in natural gas supply and demand imbalances and a subsequent sharp rise in spot prices. Henry Hub natural gas spot prices reached a record high level of $23.86/MMBtu during the Feb 17th trading session, finishing at over a tenfold increase from previous year levels. Henry Hub natural gas spot prices have returned to more normal levels over recent weeks.
Gross Withdrawals
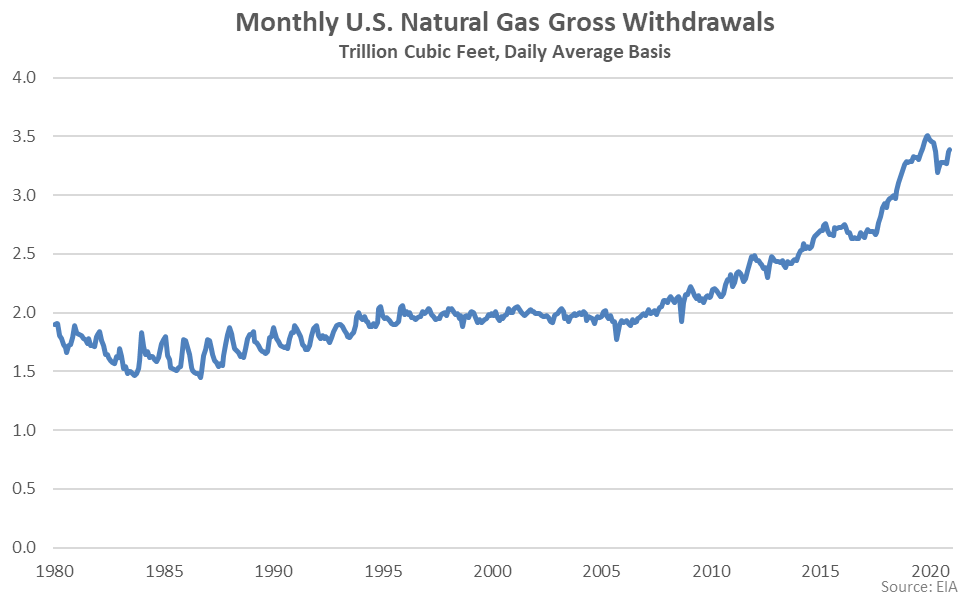
Monthly U.S. natural gas gross withdrawal figures reached a record high level throughout Dec ’19, prior to declining over five consecutive months through May ’20. Natural gas gross withdrawals have increased seasonally from the 20 month low level experienced throughout May ’20 but have remained below the Dec ’19 highs.
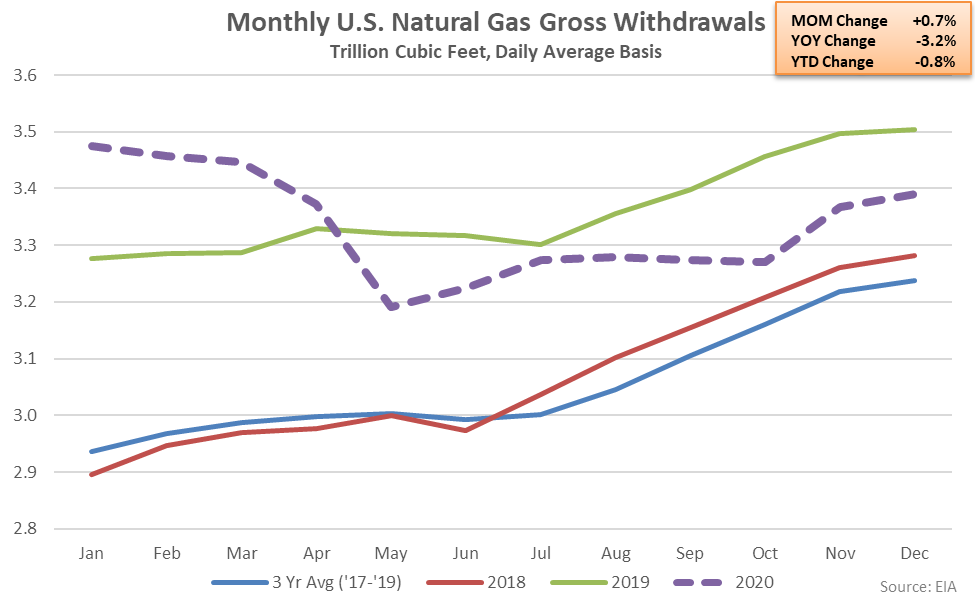
Monthly U.S. natural gas gross withdrawals have finished below previous year levels over eight consecutive months through Dec ’20. 2020 annual natural gas gross withdrawals finished 0.8% below the annual record high level experienced throughout 2019.
Well Situation
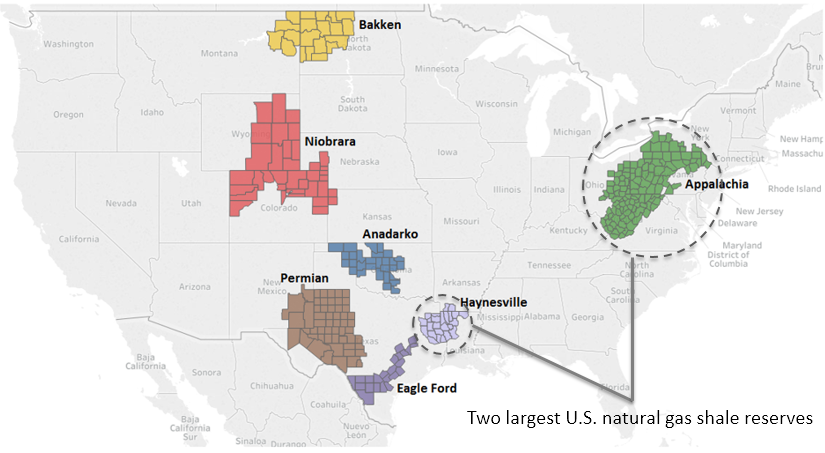
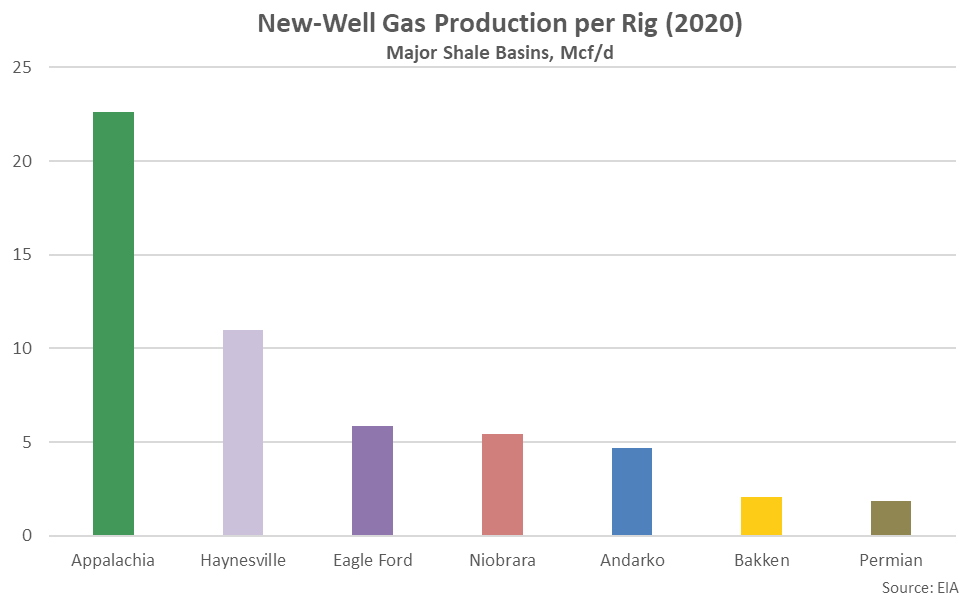
According to the EIA’s Drilling Productivity Report, nearly two-thirds of all new-well gas production was withdrawn from the Appalachia and Haynesville regions throughout 2020. The Drilling Productivity Report uses recent data on the total number of drilling rigs in operation, estimates of drilling productivity, and estimated changes in production from existing wells to provide estimated changes in oil and gas production for the seven key regions shown below.
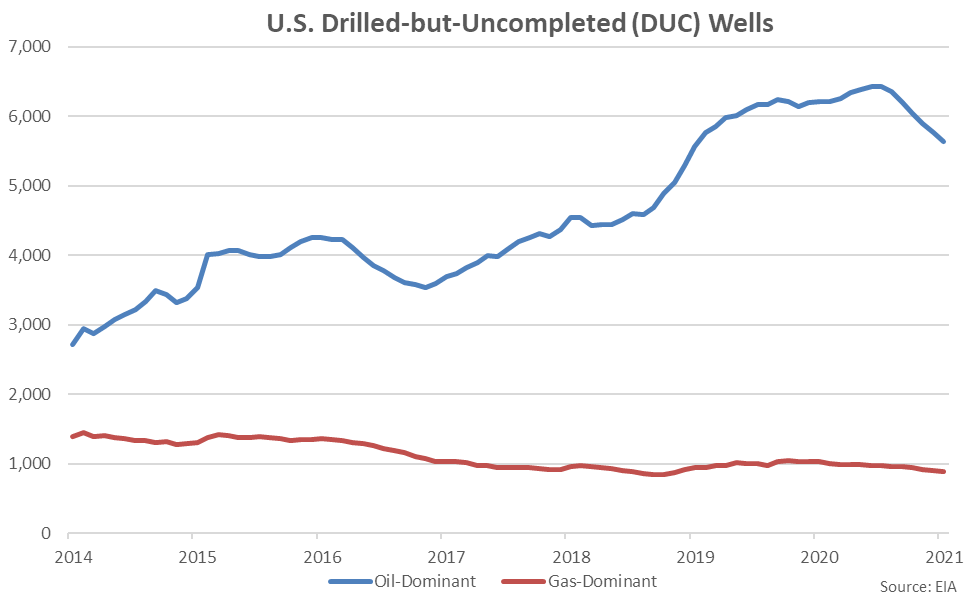
Jan ’21 U.S. drilled-but-uncompleted (DUC) wells declined to a 24 month low level within the Eagle Ford, Niobrara, Anadarko, Bakken and Permian oil-dominant regions and a 26 month low level within the Appalachia and Haynesville gas-dominant regions. DUC wells, which have been drilled by producers but have not yet been made ready for production, have been compiled since Dec ’13. Current DUC wells within the gas-dominant regions finished just 4.6% above the record low level experienced throughout Sep ’18 while DUC wells within the oil-dominant regions remained elevated overall, up 111% from the record low level experienced at the beginning of the data series.
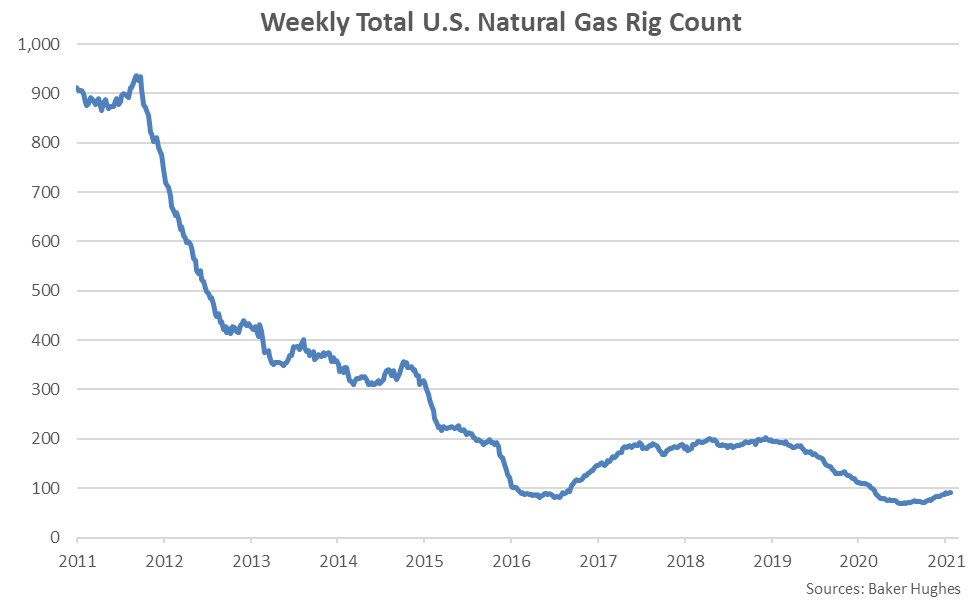
Weekly U.S. natural gas rig counts provided by Baker Hughes reached a record low level during late Jul ’20, prior to rebounding slightly over more recent weeks of available data. Weekly natural gas rig counts have been compiled since Feb ’11. Current natural gas rig counts as of the final week of Feb ’21 have rebounded 35% from the Jul ’20 lows. For comparison, crude oil rig counts have rebounded by 71% over the same period.
Domestic Consumption
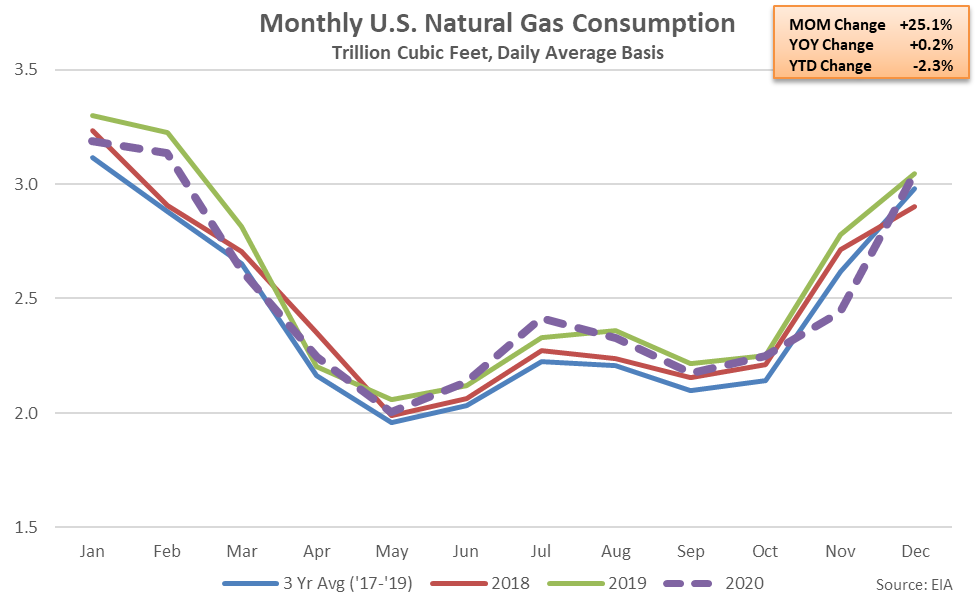
Monthly U.S. natural gas consumption figures reached a record high level throughout Jan ’19, aided by record low Midwestern temperatures. Monthly natural gas figures typically reach seasonal high levels throughout the winter months of December, January and February.
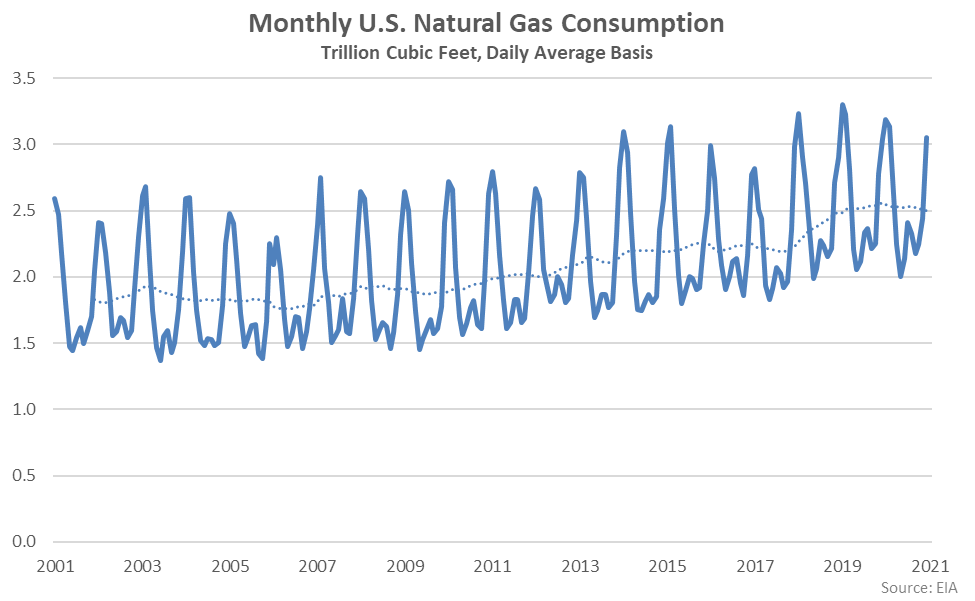
Dec ’20 U.S. natural gas consumption finished above previous year figures for the first time in the past five months, up 0.2%. 2020 annual natural gas consumption finished 2.3% lower on a YOY basis, however.
Exports
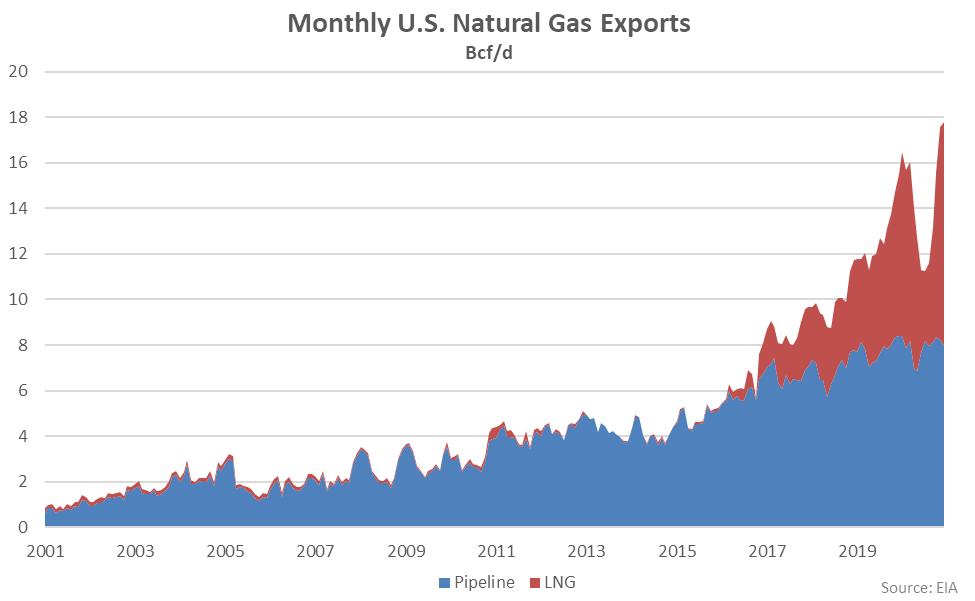
U.S. natural gas export volumes reached a record high monthly level throughout Dec ’20, aided by continued strength in liquefied natural gas (LNG) exports. LNG exports temporarily declined throughout the 2020 summer months following declines in international natural gas and LNG prices but have rebounded strongly over the past several months of available data. LNG export volumes exceeded pipeline natural gas export volumes by the widest margins on record throughout the final two months of the 2020 calendar year.
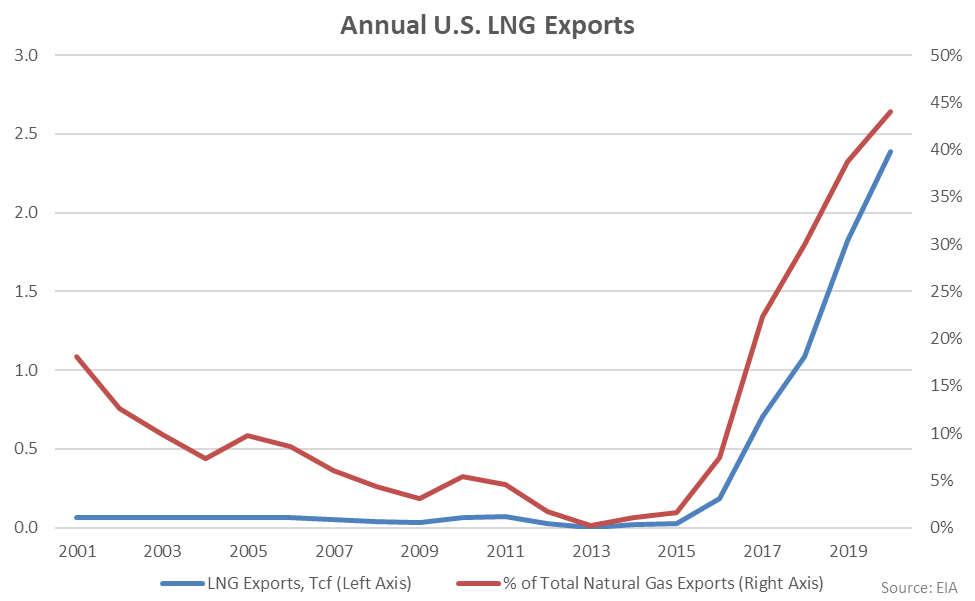
LNG export volumes have reached record high annual levels over five consecutive years through 2020. 2020 annual LNG export volumes increased 31% from the previous year, accounting for a record 44% of total natural gas export volumes throughout the year.
Inventories
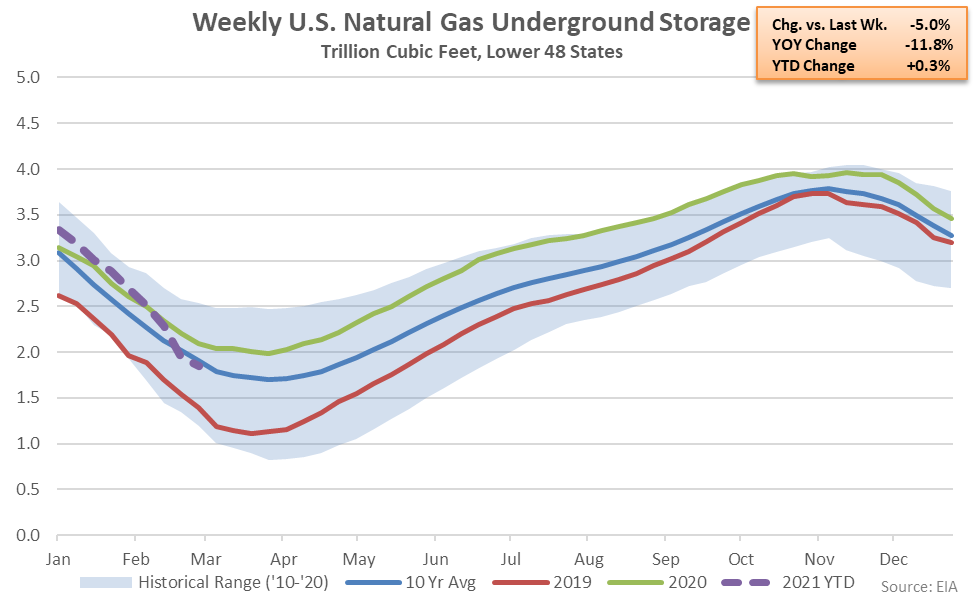
Weekly U.S. natural gas underground storage levels for the lower 48 states reached record high seasonal levels throughout the months of Aug ’20 – Oct ’20 but have been drawn down over more recent weeks of data. Underground storage levels finished below ten year average seasonal levels over the final two weeks of Feb ’21. Feb 26th week ending inventory levels finished 11.8% below previous year levels but remained above seasonal inventories experienced throughout both 2018 and 2019.
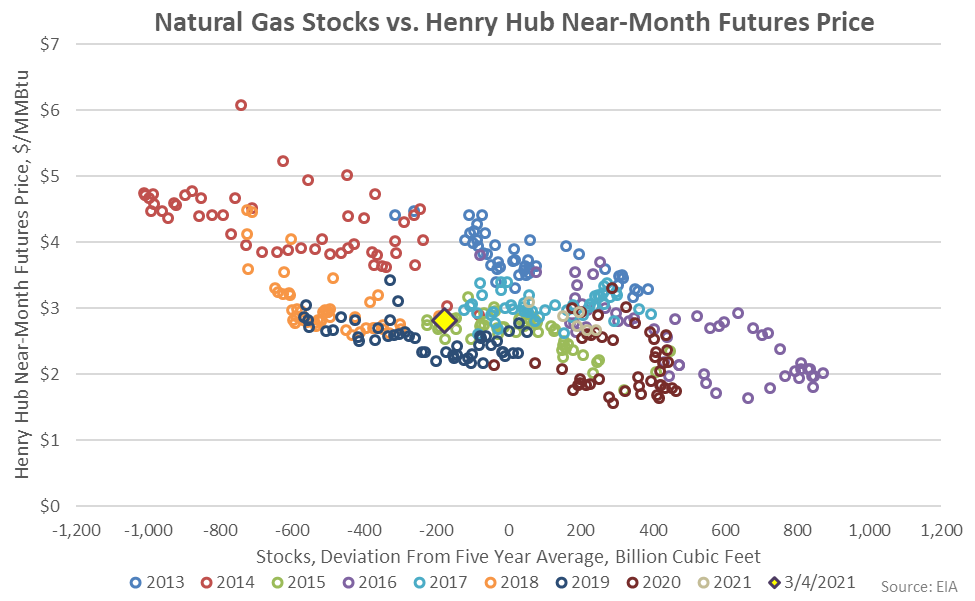
Current U.S. natural gas stocks relative to Henry Hub near-month futures prices remain within the middle range of historical figures.
Recent Spot Price Developments
Recent exceptionally cold weather experienced across most of the lower 48 states resulted in natural gas supply and demand imbalances and a subsequent sharp rise in spot prices. Natural gas production was temporarily interrupted due to freeze-offs while demand for heating and power rose simultaneously. Henry Hub natural gas spot prices reached a record high level of $23.86/MMBtu during the Feb 17th trading session, finishing at over a tenfold increase from previous year levels.
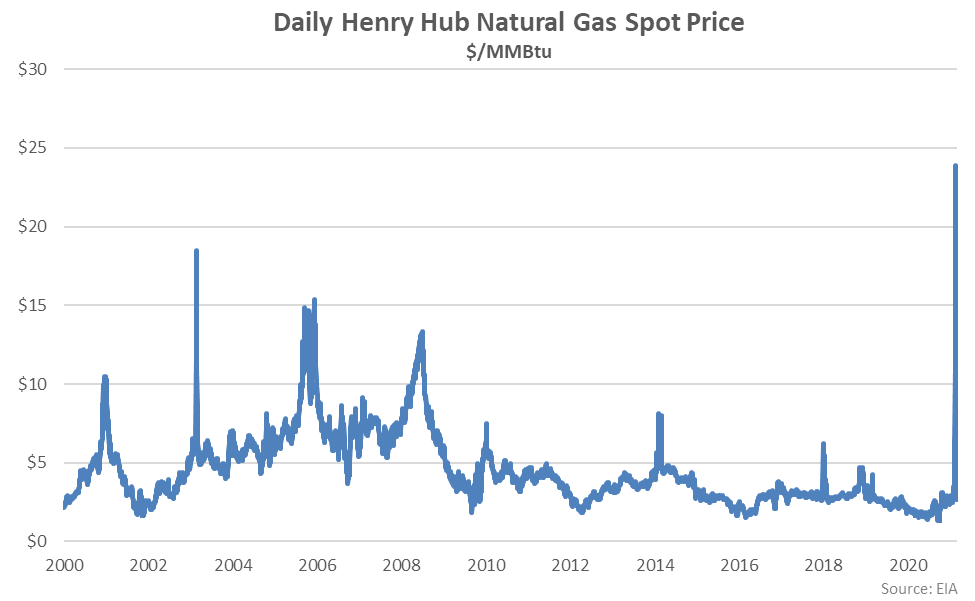
Henry Hub natural gas spot prices have returned to more normal levels over recent weeks as temperatures rose, restoring production and tempering demand. The Mar 1st spot price of $2.70/MMBtu remained 11.6% above three year average figures.
