U.S. Dairy Exports Decline YOY for Sixth Consecutive Month…
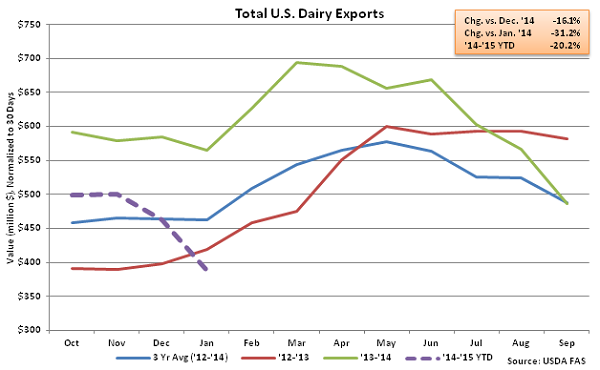
According to USDA, the total value of all U.S. dairy exports in Jan ’15 declined YOY for the sixth consecutive month, falling 31.2%. The Aug ’14 – Jan ’15 YOY declines were the first experienced in over a year and a half, with the Jan ’15 YOY decline being the largest in over five years on a percentage basis. The total value of all U.S. dairy exports also declined MOM, down 16.1% vs. Dec ’14 figures on a daily average basis to the lowest monthly figure in two and a half years. Export volumes continue to be negatively affected by a strengthening dollar relative to the currencies of traditional buyers of U.S. dairy products. A strengthening dollar results in less purchasing power for importing countries, and ultimately less foreign demand for U.S. products, all other factors being equal.
 Butter – YOY Export Volumes Decline for Ninth Consecutive Month, Finish Down 74.8%
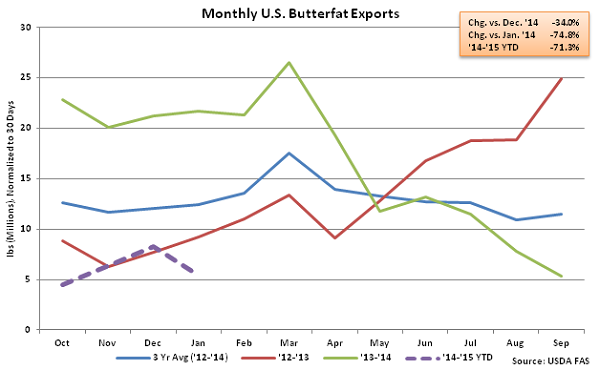
Jan ’15 export volumes of butterfat declined 74.8% YOY and 34.0% MOM on a daily average basis. Butterfat exports began to slow in the second quarter of 2014, with 2Q ’14 export sales 36.2% below 1Q ’14 export sales on a daily average basis. YOY butterfat exports have declined for nine consecutive months, with total volumes down 58.3% over the period.
U.S. butterfat exports to Middle Eastern and Northern African countries remained particularly weak, especially in Saudi Arabia, Morocco and Egypt as combined exports declined 99.6% YOY in Jan ’15. Exports to Saudi Arabia, Morocco and Egypt accounted for over two fifths of the total U.S. butterfat exports in January of last year. It has been speculated that EU-28 butter could displace U.S. butter in the Middle East due to the Russian dairy import ban that was announced in early August. Russia accounted for nearly a third of EU-28 butter exports in 2013.
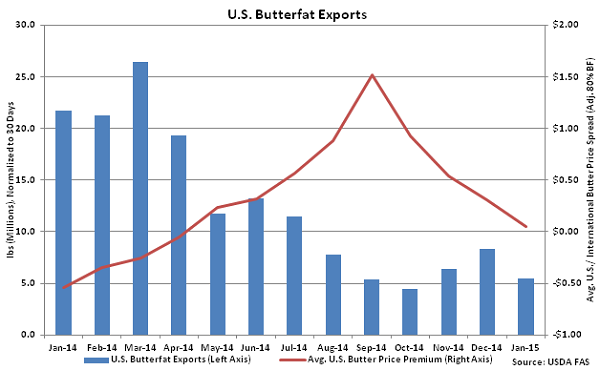
 U.S. butter prices have traded at a premium to Europe and New Zealand butter prices when adjusted to 80% butterfat since May, reducing export demand. The spreads peaked in Sep ’14, with U.S. butter prices trading at an 80.6% premium to European prices and a 128.1% premium to Oceania prices. Domestic butter price premiums have declined throughout the fourth quarter of 2014, however export volumes remain significantly below previous years.
 Cheese – YOY Export Volumes Decline for Fourth Consecutive Month, Reach Two Year Low
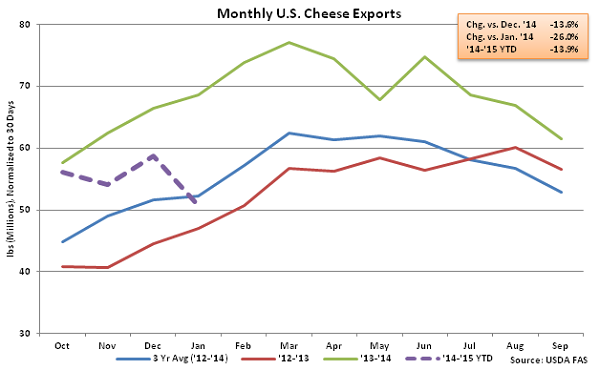
Jan ’15 U.S. cheese export volumes declined 26.0% YOY and 13.6% MOM on a daily average basis. Export volumes declined to a two year low while the 26.0% YOY decline was the largest decline on a percentage basis in over five years. The YOY decline was the fourth in a row after 16 consecutive months of YOY gains were experienced from Jun ’13 to Sep ’14. Cheddar cheese exports were particularly weak on a YOY basis, down 59.2%, a two year low on a percentage basis. Similarly to butter exports, cheese exports to Middle Eastern and North African countries were weak, with combined shipments to Saudi Arabia, Morocco and Egypt down 83.7% YOY.
 Dry Whey – YOY Exports Decline for Eight Consecutive Month, Reach Seven Year Low
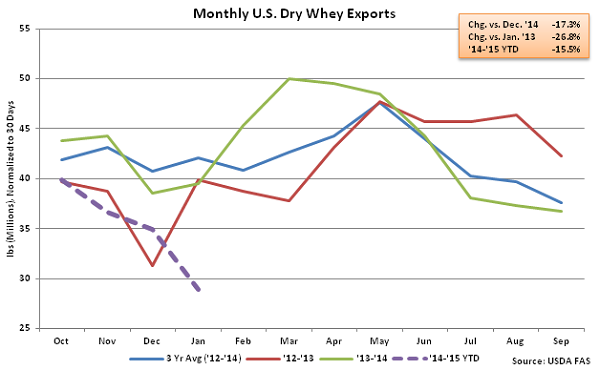
Jan ’15 export volumes of dry whey declined 26.8% YOY and 17.3% MOM on a daily average basis. Export volumes declined to a seven year low while the 26.8% YOY decline was the largest decline on a percentage basis in over two years. YOY dry whey export volumes have declined for eight consecutive months after beginning the ’13-’14 production season with YOY increases in seven of the first eight months.
 NFDM/SMP – YOY Exports Decline for Sixth Consecutive Month, Finish Down 9.8% YOY
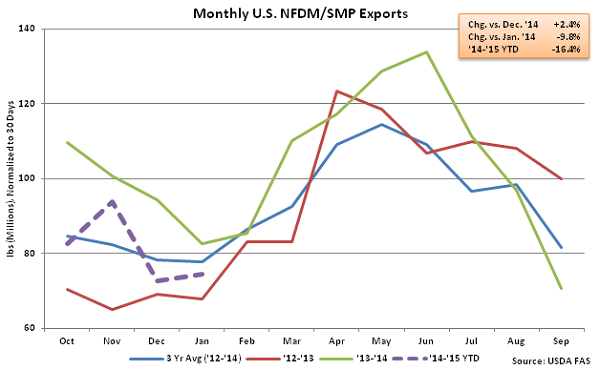
Jan ’15 export volumes of NFDM/SMP increased 2.4% MOM on a daily average basis but remain lower YOY, down 9.8%. NFDM/SMP exports have declined for six consecutive months after increasing for 15 of the 16 months leading up to Aug ’14. Total volumes have declined by 17.4% over the period. YOY declines persisted despite export volumes to Mexico remaining strong, up 17.0% over the six month period. U.S. NFDM/SMP exports to Mexico accounted for over half of the Jan ’15 shipments. NFDM/SMP exports to China have weakened considerably, down 65.0% from Sep ’14 – Jan ’15.
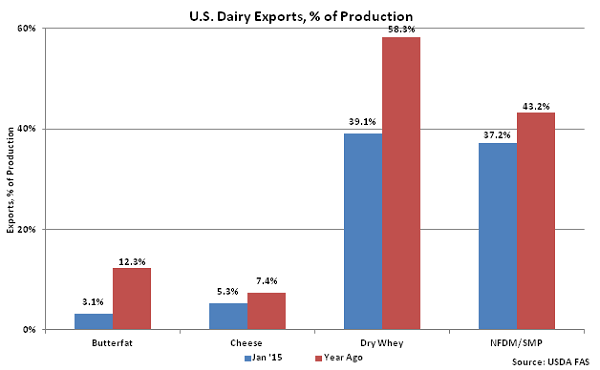
 See the chart below for a summary of key U.S. dairy product exports as a percentage of production in Jan ’15 vs. a year ago.
 Butter – YOY Export Volumes Decline for Ninth Consecutive Month, Finish Down 74.8%
Jan ’15 export volumes of butterfat declined 74.8% YOY and 34.0% MOM on a daily average basis. Butterfat exports began to slow in the second quarter of 2014, with 2Q ’14 export sales 36.2% below 1Q ’14 export sales on a daily average basis. YOY butterfat exports have declined for nine consecutive months, with total volumes down 58.3% over the period.
U.S. butterfat exports to Middle Eastern and Northern African countries remained particularly weak, especially in Saudi Arabia, Morocco and Egypt as combined exports declined 99.6% YOY in Jan ’15. Exports to Saudi Arabia, Morocco and Egypt accounted for over two fifths of the total U.S. butterfat exports in January of last year. It has been speculated that EU-28 butter could displace U.S. butter in the Middle East due to the Russian dairy import ban that was announced in early August. Russia accounted for nearly a third of EU-28 butter exports in 2013.
 U.S. butter prices have traded at a premium to Europe and New Zealand butter prices when adjusted to 80% butterfat since May, reducing export demand. The spreads peaked in Sep ’14, with U.S. butter prices trading at an 80.6% premium to European prices and a 128.1% premium to Oceania prices. Domestic butter price premiums have declined throughout the fourth quarter of 2014, however export volumes remain significantly below previous years.
 Cheese – YOY Export Volumes Decline for Fourth Consecutive Month, Reach Two Year Low
Jan ’15 U.S. cheese export volumes declined 26.0% YOY and 13.6% MOM on a daily average basis. Export volumes declined to a two year low while the 26.0% YOY decline was the largest decline on a percentage basis in over five years. The YOY decline was the fourth in a row after 16 consecutive months of YOY gains were experienced from Jun ’13 to Sep ’14. Cheddar cheese exports were particularly weak on a YOY basis, down 59.2%, a two year low on a percentage basis. Similarly to butter exports, cheese exports to Middle Eastern and North African countries were weak, with combined shipments to Saudi Arabia, Morocco and Egypt down 83.7% YOY.
 Dry Whey – YOY Exports Decline for Eight Consecutive Month, Reach Seven Year Low
Jan ’15 export volumes of dry whey declined 26.8% YOY and 17.3% MOM on a daily average basis. Export volumes declined to a seven year low while the 26.8% YOY decline was the largest decline on a percentage basis in over two years. YOY dry whey export volumes have declined for eight consecutive months after beginning the ’13-’14 production season with YOY increases in seven of the first eight months.
 NFDM/SMP – YOY Exports Decline for Sixth Consecutive Month, Finish Down 9.8% YOY
Jan ’15 export volumes of NFDM/SMP increased 2.4% MOM on a daily average basis but remain lower YOY, down 9.8%. NFDM/SMP exports have declined for six consecutive months after increasing for 15 of the 16 months leading up to Aug ’14. Total volumes have declined by 17.4% over the period. YOY declines persisted despite export volumes to Mexico remaining strong, up 17.0% over the six month period. U.S. NFDM/SMP exports to Mexico accounted for over half of the Jan ’15 shipments. NFDM/SMP exports to China have weakened considerably, down 65.0% from Sep ’14 – Jan ’15.
 See the chart below for a summary of key U.S. dairy product exports as a percentage of production in Jan ’15 vs. a year ago.
