U.S. Dairy Commercial Disappearance Update – Nov ’16
U.S. Dairy Commercial Disappearance Update – Nov ’16
Executive Summary
U.S. dairy commercial disappearance figures provided by USDA were recently updated with values spanning through Sep ’16. Highlights from the updated report include:
 Butter – Disappearance Increases Sharply to a Record Seasonal High, Finish up 15.0% YOY
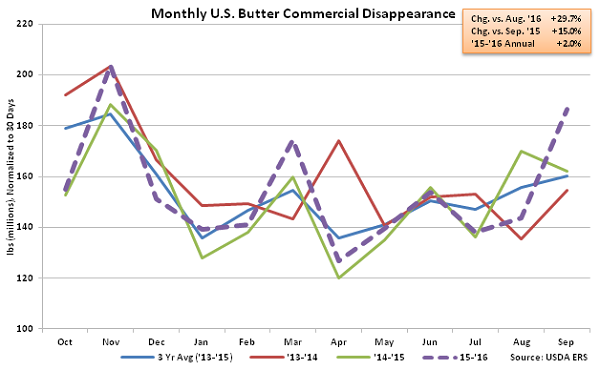
Sep ’16 U.S. butter commercial disappearance increased sharply, finishing up 29.7% MOM on a daily average basis and 15.0% YOY, reaching a record seasonal high for the month of September. The YOY increase in butter commercial disappearance was the largest experienced in over a year on a percentage basis. Sep ’16 domestic butter demand increased 13.8% YOY to a new record seasonal high while international demand increased 243.5% from the six year low experienced during the previous year. ’14-’15 annual U.S. butter commercial disappearance declined 5.1% YOY to a three year low as a 74.8% decline in export volumes more than offset a 1.8% increase in domestic demand. ’15-’16 annual U.S. butter disappearance rebounded by 2.0% YOY as a 3.2% increase in domestic demand more than offset continued weak export volumes.
Butter – Disappearance Increases Sharply to a Record Seasonal High, Finish up 15.0% YOY
Sep ’16 U.S. butter commercial disappearance increased sharply, finishing up 29.7% MOM on a daily average basis and 15.0% YOY, reaching a record seasonal high for the month of September. The YOY increase in butter commercial disappearance was the largest experienced in over a year on a percentage basis. Sep ’16 domestic butter demand increased 13.8% YOY to a new record seasonal high while international demand increased 243.5% from the six year low experienced during the previous year. ’14-’15 annual U.S. butter commercial disappearance declined 5.1% YOY to a three year low as a 74.8% decline in export volumes more than offset a 1.8% increase in domestic demand. ’15-’16 annual U.S. butter disappearance rebounded by 2.0% YOY as a 3.2% increase in domestic demand more than offset continued weak export volumes.
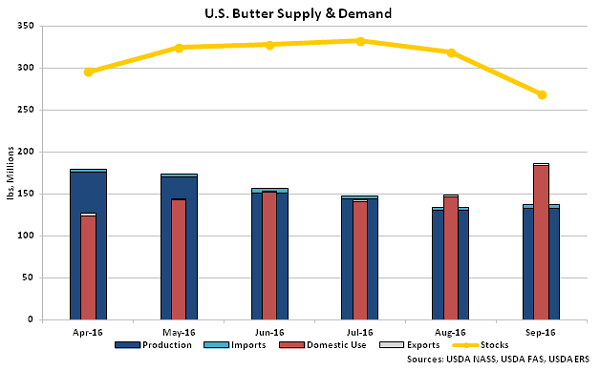
 Sep ’16 U.S. butter disappearance figures outpaced production and import volumes, resulting in the second consecutive monthly decline in stocks. Butter stocks typically decline seasonally until lows are reached during the month of November.
 Cheese – Disappearance Finishes Flat on a YOY Basis, Remains at a September Record High
Sep ’16 U.S. cheese commercial disappearance finished flat on a YOY basis, remaining at a record high figure for the month of September. YOY increases in cheese disappearance had been exhibited over 14 consecutive months prior to figures finishing flat during Sep ’16. Other-than-American cheese disappearance increased 2.1% throughout the month, offsetting a 3.3% decline in American cheese disappearance. Domestic cheese demand increased on a YOY basis for the 25th consecutive month, finishing slightly above the previous year, while export demand declined 0.7% throughout the month. ’14-’15 annual U.S. cheese commercial disappearance finished up 2.1% YOY to a new record annual high as a 3.4% increase in domestic demand more than offset a 13.9% decline in export demand. Domestic cheese disappearance increased an additional 3.6% throughout the ’15-’16 production season, more than offsetting a 14.0% decline in export demand. American cheese disappearance increased just 0.3% throughout the ’15-’16 production season however other-than-American cheese disappearance increased by 4.1% over the period.
Cheese – Disappearance Finishes Flat on a YOY Basis, Remains at a September Record High
Sep ’16 U.S. cheese commercial disappearance finished flat on a YOY basis, remaining at a record high figure for the month of September. YOY increases in cheese disappearance had been exhibited over 14 consecutive months prior to figures finishing flat during Sep ’16. Other-than-American cheese disappearance increased 2.1% throughout the month, offsetting a 3.3% decline in American cheese disappearance. Domestic cheese demand increased on a YOY basis for the 25th consecutive month, finishing slightly above the previous year, while export demand declined 0.7% throughout the month. ’14-’15 annual U.S. cheese commercial disappearance finished up 2.1% YOY to a new record annual high as a 3.4% increase in domestic demand more than offset a 13.9% decline in export demand. Domestic cheese disappearance increased an additional 3.6% throughout the ’15-’16 production season, more than offsetting a 14.0% decline in export demand. American cheese disappearance increased just 0.3% throughout the ’15-’16 production season however other-than-American cheese disappearance increased by 4.1% over the period.
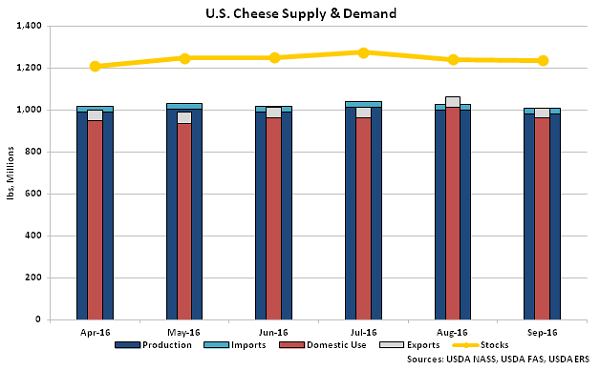
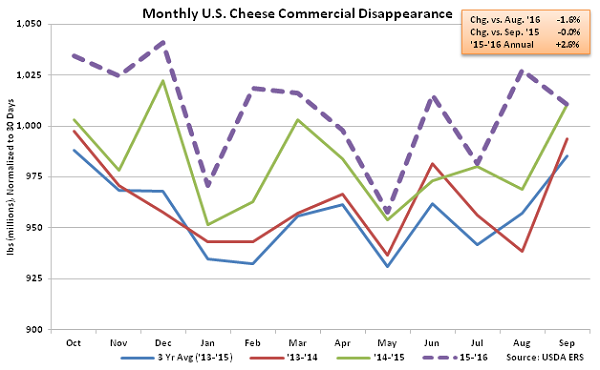 Sep ’16 U.S. cheese disappearance figures outpaced production and import volumes, resulting in the second consecutive monthly decline in stocks.
 Dry Whey – Disappearance Declines on a YOY Basis for the First Time in Five Months
Sep ’16 U.S. dry whey commercial disappearance declined on a YOY basis for the first time in five months, finishing down 7.1%. Domestic dry whey demand declined 23.4% throughout the month, more than offsetting a 35.8% increase in export volumes. ’14-’15 annual U.S. dry whey commercial disappearance increased 0.4% YOY as a 24.7% increase in domestic demand more than offset an 18.0% decline in export demand. ’15-’16 annual U.S. dry whey disappearance finished up an additional 7.0% YOY as domestic demand increased to an eight year high.
Dry Whey – Disappearance Declines on a YOY Basis for the First Time in Five Months
Sep ’16 U.S. dry whey commercial disappearance declined on a YOY basis for the first time in five months, finishing down 7.1%. Domestic dry whey demand declined 23.4% throughout the month, more than offsetting a 35.8% increase in export volumes. ’14-’15 annual U.S. dry whey commercial disappearance increased 0.4% YOY as a 24.7% increase in domestic demand more than offset an 18.0% decline in export demand. ’15-’16 annual U.S. dry whey disappearance finished up an additional 7.0% YOY as domestic demand increased to an eight year high.
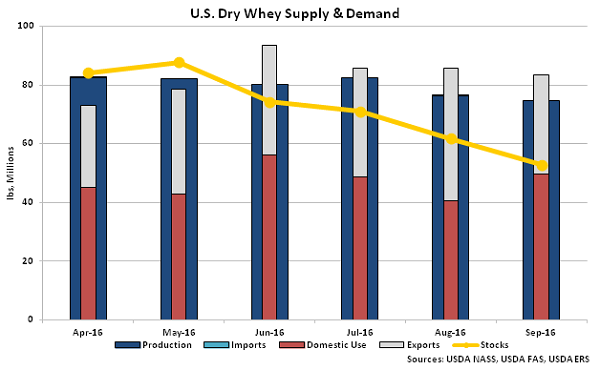
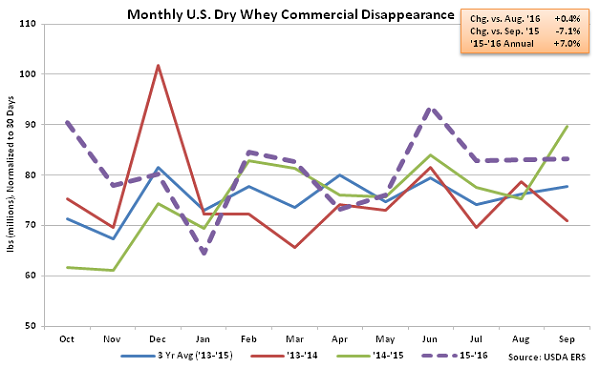 Sep ’16 U.S. dry whey total disappearance outpaced production and import volumes for the fourth consecutive month, resulting in a continued decline in stocks.
 WPC – Disappearance Rebounds Sharply on Strong Domestic Demand, Finishes up 8.7% YOY
Sep ’16 U.S. whey protein concentrate (WPC) commercial disappearance rebounded sharply from the three and a half year low experienced during the previous month, increasing 25.0% MOM on a daily average basis and 8.7% YOY. WPC export volumes declined on a YOY basis for the first time in over a year, finishing down 2.6%, however the decline in export volumes was more than offset by a 32.5% YOY increase in domestic demand. ’14-’15 annual U.S. WPC commercial disappearance declined 6.1% YOY on lower domestic and export demand however ’15-’16 annual U.S. WPC disappearance rebounded by 0.7% as export demand finished at a record annual high.
WPC – Disappearance Rebounds Sharply on Strong Domestic Demand, Finishes up 8.7% YOY
Sep ’16 U.S. whey protein concentrate (WPC) commercial disappearance rebounded sharply from the three and a half year low experienced during the previous month, increasing 25.0% MOM on a daily average basis and 8.7% YOY. WPC export volumes declined on a YOY basis for the first time in over a year, finishing down 2.6%, however the decline in export volumes was more than offset by a 32.5% YOY increase in domestic demand. ’14-’15 annual U.S. WPC commercial disappearance declined 6.1% YOY on lower domestic and export demand however ’15-’16 annual U.S. WPC disappearance rebounded by 0.7% as export demand finished at a record annual high.
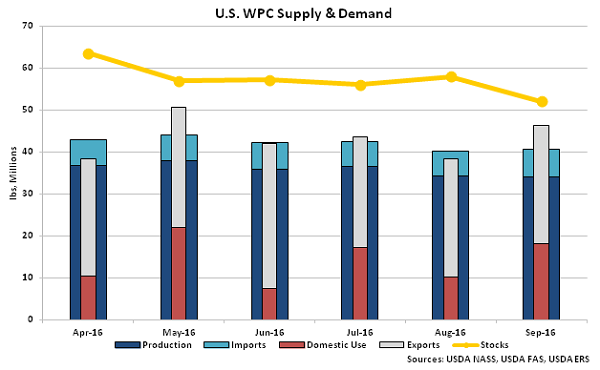
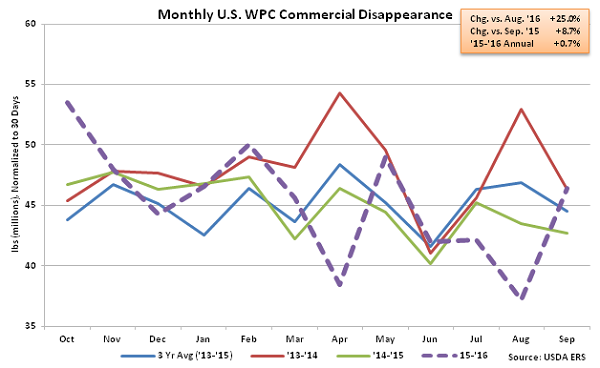 Sep ’16 U.S. WPC total disappearance outpaced production and import volumes, resulting in stocks declining to a 28 month low.
 NFDM/SMP – Disappearance Increases YOY for the First Time in Three Months, Finishes up 9.9%
Sep ’16 U.S. nonfat dry milk (NFDM) and skim milk powder (SMP) commercial disappearance finished higher on a YOY basis for the first time in three months, increasing by 9.9%. U.S. NFDM/SMP domestic disappearance increased 17.0% throughout the month while export volumes increased 5.6%, finishing higher for the third consecutive month. ’14-’15 annual U.S. NFDM/SMP commercial disappearance finished up 2.9% YOY as a 15.4% increase in domestic demand more than offset a 6.5% decline in export demand. ’15-’16 annual U.S. NFDM/SMP disappearance declined 0.7%, however, as export volumes increased 2.2% but domestic demand declined 3.8%.
NFDM/SMP – Disappearance Increases YOY for the First Time in Three Months, Finishes up 9.9%
Sep ’16 U.S. nonfat dry milk (NFDM) and skim milk powder (SMP) commercial disappearance finished higher on a YOY basis for the first time in three months, increasing by 9.9%. U.S. NFDM/SMP domestic disappearance increased 17.0% throughout the month while export volumes increased 5.6%, finishing higher for the third consecutive month. ’14-’15 annual U.S. NFDM/SMP commercial disappearance finished up 2.9% YOY as a 15.4% increase in domestic demand more than offset a 6.5% decline in export demand. ’15-’16 annual U.S. NFDM/SMP disappearance declined 0.7%, however, as export volumes increased 2.2% but domestic demand declined 3.8%.
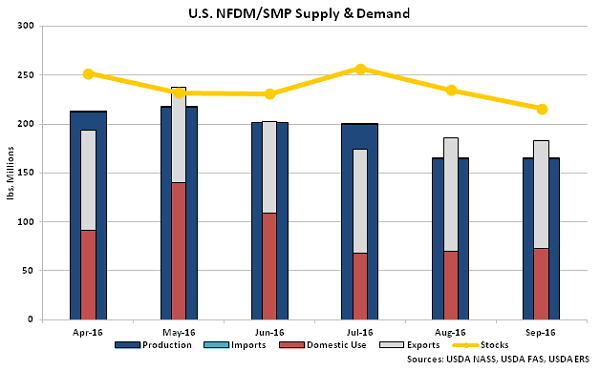
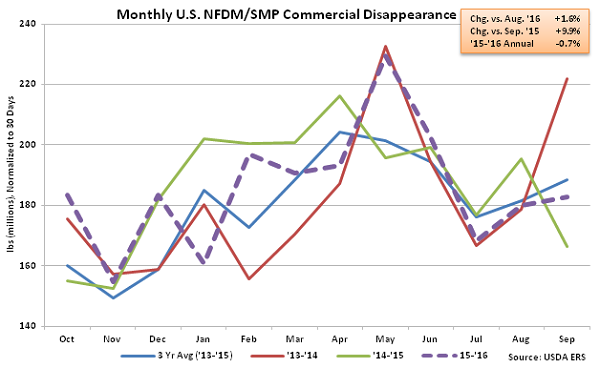 Sep ’16 U.S. NFDM/SMP total disappearance outpaced production and import volumes for the second consecutive month, resulting in a stocks declining to a nine month low. NFDM/SMP stocks typically decline seasonally until lows are reached during the month of October.
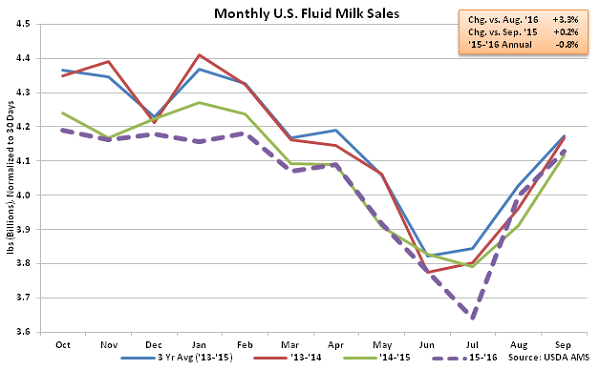
 Fluid Milk Sales – Total Milk Sales Increase for the Second Consecutive Month, Finish up 0.2%
Sep ’16 U.S. fluid milk sales of 4.13 billion pounds increased 3.3% MOM on a daily average basis while also finishing higher on a YOY basis for the second consecutive month, increasing by 0.2%. The consecutive YOY increases in fluid milk sales were the first experienced in over six and a half years. Sales of whole milk remained strong, finishing up 6.1% YOY, while fat-free milk sales declined 11.4% YOY throughout the month. ’15-’16 annual U.S. total fluid milk sales declined to a record low for the sixth consecutive year, finished down 0.8% YOY. Annual whole milk sales finished up 6.1% however annual fat-free milk sales declined 11.3% throughout the year.
Fluid Milk Sales – Total Milk Sales Increase for the Second Consecutive Month, Finish up 0.2%
Sep ’16 U.S. fluid milk sales of 4.13 billion pounds increased 3.3% MOM on a daily average basis while also finishing higher on a YOY basis for the second consecutive month, increasing by 0.2%. The consecutive YOY increases in fluid milk sales were the first experienced in over six and a half years. Sales of whole milk remained strong, finishing up 6.1% YOY, while fat-free milk sales declined 11.4% YOY throughout the month. ’15-’16 annual U.S. total fluid milk sales declined to a record low for the sixth consecutive year, finished down 0.8% YOY. Annual whole milk sales finished up 6.1% however annual fat-free milk sales declined 11.3% throughout the year.
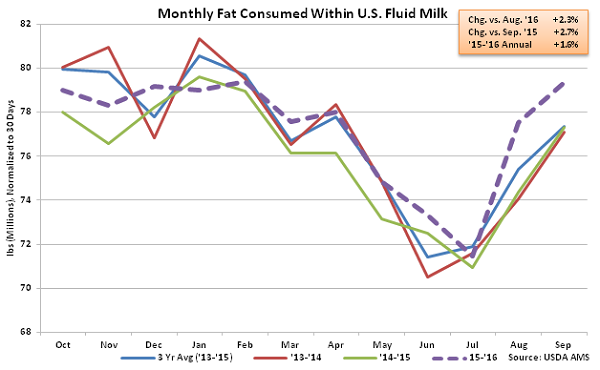
 Fat consumed within U.S. fluid milk remained higher for the eighth consecutive month during Sep ’16, finishing up 2.7%. Total fat consumed within U.S. fluid milk finished up 1.6% YOY throughout the ’15-’16 production season.
 Overall, Sep ’16 domestic commercial disappearance increased most significantly on a YOY basis for WPC, followed by NFDM/SMP and butter, while butter and dry whey international disappearance finished most significantly higher throughout the month.
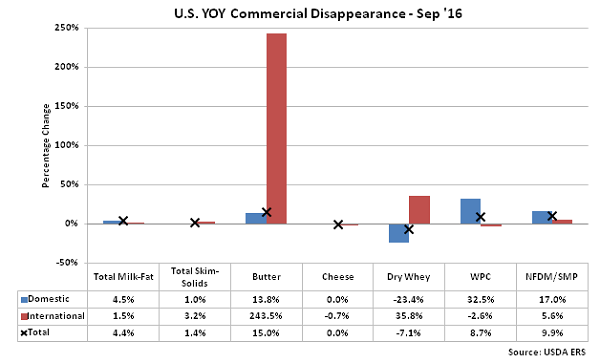
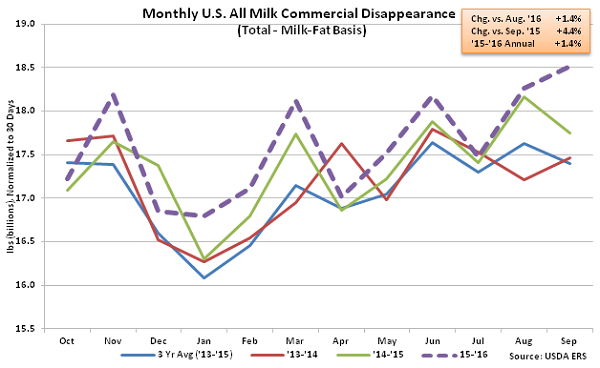
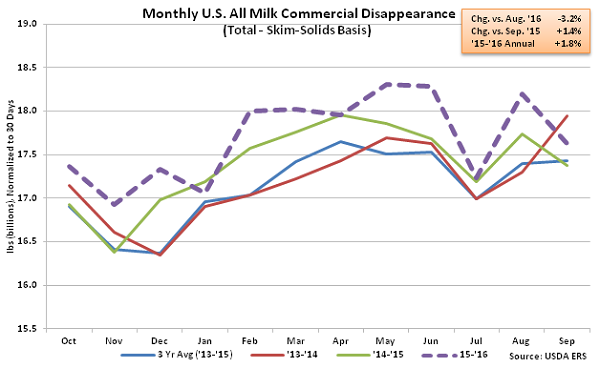
- Sep ’16 U.S. commercial disappearance for milk used in all products remained at or near record high seasonal levels as both domestic and export demand finished higher throughout the month.
- Sep ’16 commercial disappearance of butter and cheese each finished at record seasonal highs as domestic demand remained strong.
- U.S. fluid milk sales increased on a YOY basis for the second consecutive month during Sep ’16, finishing up 0.2%. ’15-’16 annual fluid milk sales declined to a record low for the sixth consecutive year, however, as sales of skim milk remained particularly weak.
Butter – Disappearance Increases Sharply to a Record Seasonal High, Finish up 15.0% YOY
Sep ’16 U.S. butter commercial disappearance increased sharply, finishing up 29.7% MOM on a daily average basis and 15.0% YOY, reaching a record seasonal high for the month of September. The YOY increase in butter commercial disappearance was the largest experienced in over a year on a percentage basis. Sep ’16 domestic butter demand increased 13.8% YOY to a new record seasonal high while international demand increased 243.5% from the six year low experienced during the previous year. ’14-’15 annual U.S. butter commercial disappearance declined 5.1% YOY to a three year low as a 74.8% decline in export volumes more than offset a 1.8% increase in domestic demand. ’15-’16 annual U.S. butter disappearance rebounded by 2.0% YOY as a 3.2% increase in domestic demand more than offset continued weak export volumes.
Sep ’16 U.S. butter disappearance figures outpaced production and import volumes, resulting in the second consecutive monthly decline in stocks. Butter stocks typically decline seasonally until lows are reached during the month of November.
Cheese – Disappearance Finishes Flat on a YOY Basis, Remains at a September Record High
Sep ’16 U.S. cheese commercial disappearance finished flat on a YOY basis, remaining at a record high figure for the month of September. YOY increases in cheese disappearance had been exhibited over 14 consecutive months prior to figures finishing flat during Sep ’16. Other-than-American cheese disappearance increased 2.1% throughout the month, offsetting a 3.3% decline in American cheese disappearance. Domestic cheese demand increased on a YOY basis for the 25th consecutive month, finishing slightly above the previous year, while export demand declined 0.7% throughout the month. ’14-’15 annual U.S. cheese commercial disappearance finished up 2.1% YOY to a new record annual high as a 3.4% increase in domestic demand more than offset a 13.9% decline in export demand. Domestic cheese disappearance increased an additional 3.6% throughout the ’15-’16 production season, more than offsetting a 14.0% decline in export demand. American cheese disappearance increased just 0.3% throughout the ’15-’16 production season however other-than-American cheese disappearance increased by 4.1% over the period.
Sep ’16 U.S. cheese disappearance figures outpaced production and import volumes, resulting in the second consecutive monthly decline in stocks.
Dry Whey – Disappearance Declines on a YOY Basis for the First Time in Five Months
Sep ’16 U.S. dry whey commercial disappearance declined on a YOY basis for the first time in five months, finishing down 7.1%. Domestic dry whey demand declined 23.4% throughout the month, more than offsetting a 35.8% increase in export volumes. ’14-’15 annual U.S. dry whey commercial disappearance increased 0.4% YOY as a 24.7% increase in domestic demand more than offset an 18.0% decline in export demand. ’15-’16 annual U.S. dry whey disappearance finished up an additional 7.0% YOY as domestic demand increased to an eight year high.
Sep ’16 U.S. dry whey total disappearance outpaced production and import volumes for the fourth consecutive month, resulting in a continued decline in stocks.
WPC – Disappearance Rebounds Sharply on Strong Domestic Demand, Finishes up 8.7% YOY
Sep ’16 U.S. whey protein concentrate (WPC) commercial disappearance rebounded sharply from the three and a half year low experienced during the previous month, increasing 25.0% MOM on a daily average basis and 8.7% YOY. WPC export volumes declined on a YOY basis for the first time in over a year, finishing down 2.6%, however the decline in export volumes was more than offset by a 32.5% YOY increase in domestic demand. ’14-’15 annual U.S. WPC commercial disappearance declined 6.1% YOY on lower domestic and export demand however ’15-’16 annual U.S. WPC disappearance rebounded by 0.7% as export demand finished at a record annual high.
Sep ’16 U.S. WPC total disappearance outpaced production and import volumes, resulting in stocks declining to a 28 month low.
NFDM/SMP – Disappearance Increases YOY for the First Time in Three Months, Finishes up 9.9%
Sep ’16 U.S. nonfat dry milk (NFDM) and skim milk powder (SMP) commercial disappearance finished higher on a YOY basis for the first time in three months, increasing by 9.9%. U.S. NFDM/SMP domestic disappearance increased 17.0% throughout the month while export volumes increased 5.6%, finishing higher for the third consecutive month. ’14-’15 annual U.S. NFDM/SMP commercial disappearance finished up 2.9% YOY as a 15.4% increase in domestic demand more than offset a 6.5% decline in export demand. ’15-’16 annual U.S. NFDM/SMP disappearance declined 0.7%, however, as export volumes increased 2.2% but domestic demand declined 3.8%.
Sep ’16 U.S. NFDM/SMP total disappearance outpaced production and import volumes for the second consecutive month, resulting in a stocks declining to a nine month low. NFDM/SMP stocks typically decline seasonally until lows are reached during the month of October.
Fluid Milk Sales – Total Milk Sales Increase for the Second Consecutive Month, Finish up 0.2%
Sep ’16 U.S. fluid milk sales of 4.13 billion pounds increased 3.3% MOM on a daily average basis while also finishing higher on a YOY basis for the second consecutive month, increasing by 0.2%. The consecutive YOY increases in fluid milk sales were the first experienced in over six and a half years. Sales of whole milk remained strong, finishing up 6.1% YOY, while fat-free milk sales declined 11.4% YOY throughout the month. ’15-’16 annual U.S. total fluid milk sales declined to a record low for the sixth consecutive year, finished down 0.8% YOY. Annual whole milk sales finished up 6.1% however annual fat-free milk sales declined 11.3% throughout the year.
Fat consumed within U.S. fluid milk remained higher for the eighth consecutive month during Sep ’16, finishing up 2.7%. Total fat consumed within U.S. fluid milk finished up 1.6% YOY throughout the ’15-’16 production season.
Overall, Sep ’16 domestic commercial disappearance increased most significantly on a YOY basis for WPC, followed by NFDM/SMP and butter, while butter and dry whey international disappearance finished most significantly higher throughout the month.