U.S. Dairy Exports Update – Jan ’17
Executive Summary
U.S. dairy export figures provided by USDA were recently updated with values spanning through Nov ’16. Highlights from the updated report include:
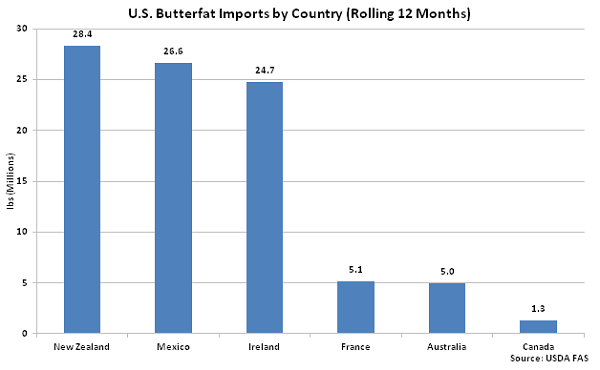
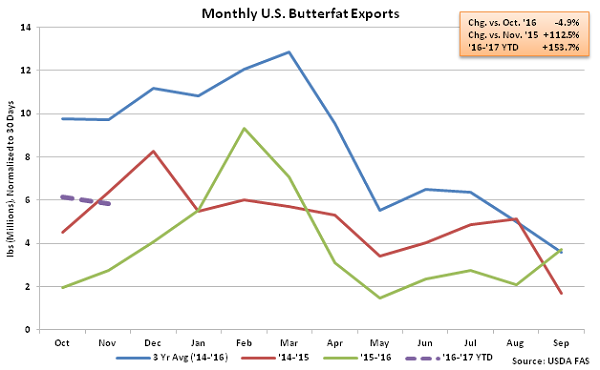 ’15-’16 annual U.S. butterfat imports increased 27.1% YOY, finishing at a new record high, while butterfat export volumes declined 23.9% YOY over the same period. Growth in butterfat imports over the past 12 months has been led by product shipped from New Zealand, followed closely by imports of butterfat from Mexico and Ireland.
 Cheese – Export Volumes Finish Higher on a YOY Basis Despite Weak Cheddar Demand
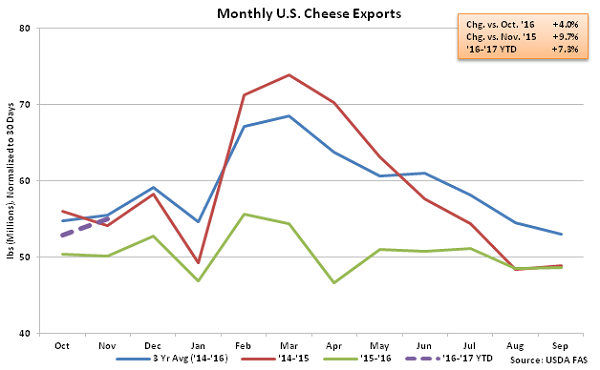
Nov ’16 U.S. cheese export volumes increased 4.0% MOM on a daily average basis while also finishing 9.7% higher on a YOY basis. The YOY increase in cheese export volumes was only the third experienced throughout the past two years. The YOY increase in cheese export volumes occurred despite cheddar cheese export volumes declining by 12.4% throughout the month. Other-than-cheddar cheese export volumes increased 12.4% YOY throughout the month, more than offsetting the weak cheddar cheese demand. Despite finishing higher on a YOY basis, Nov ’16 cheese export volumes remained 0.9% below three year average figures for the month of November.
Nov ’16 YOY increases in cheese export volumes were led by product destined to Mexico (+39.3%) and South Korea (+12.4%), which more than offset a 3.7% decline in export volumes destined to Japan. Cheese volumes destined to Mexico, South Korea and Japan accounted for over half of the total U.S. cheese shipments throughout the month.
Cheese – Export Volumes Finish Higher on a YOY Basis Despite Weak Cheddar Demand
Nov ’16 U.S. cheese export volumes increased 4.0% MOM on a daily average basis while also finishing 9.7% higher on a YOY basis. The YOY increase in cheese export volumes was only the third experienced throughout the past two years. The YOY increase in cheese export volumes occurred despite cheddar cheese export volumes declining by 12.4% throughout the month. Other-than-cheddar cheese export volumes increased 12.4% YOY throughout the month, more than offsetting the weak cheddar cheese demand. Despite finishing higher on a YOY basis, Nov ’16 cheese export volumes remained 0.9% below three year average figures for the month of November.
Nov ’16 YOY increases in cheese export volumes were led by product destined to Mexico (+39.3%) and South Korea (+12.4%), which more than offset a 3.7% decline in export volumes destined to Japan. Cheese volumes destined to Mexico, South Korea and Japan accounted for over half of the total U.S. cheese shipments throughout the month.
 Dry Whey – Export Volumes Increase on a YOY Basis for the Fifth Consecutive Month, up 51.8%
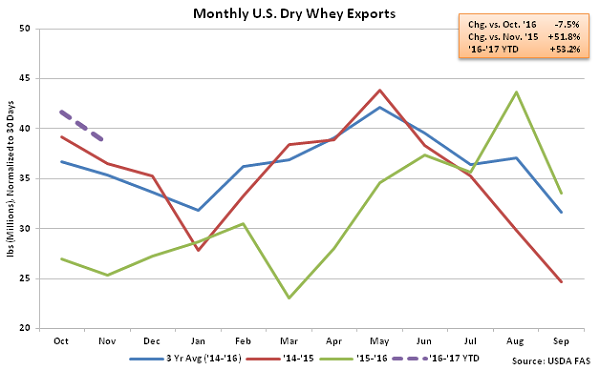
Nov ’16 U.S. dry whey export volumes declined 7.5% MOM on a daily average basis but remained significantly higher on a YOY basis, finishing up 51.8%. U.S. dry whey export volumes have increased on a YOY basis over five consecutive months through November. YOY increases in dry whey export volumes continue to be led by product destined to China, which increased by 266.6% throughout the month. Dry whey export volume destined to China accounted for over a third of all dry whey volumes shipped throughout the month.
Dry Whey – Export Volumes Increase on a YOY Basis for the Fifth Consecutive Month, up 51.8%
Nov ’16 U.S. dry whey export volumes declined 7.5% MOM on a daily average basis but remained significantly higher on a YOY basis, finishing up 51.8%. U.S. dry whey export volumes have increased on a YOY basis over five consecutive months through November. YOY increases in dry whey export volumes continue to be led by product destined to China, which increased by 266.6% throughout the month. Dry whey export volume destined to China accounted for over a third of all dry whey volumes shipped throughout the month.
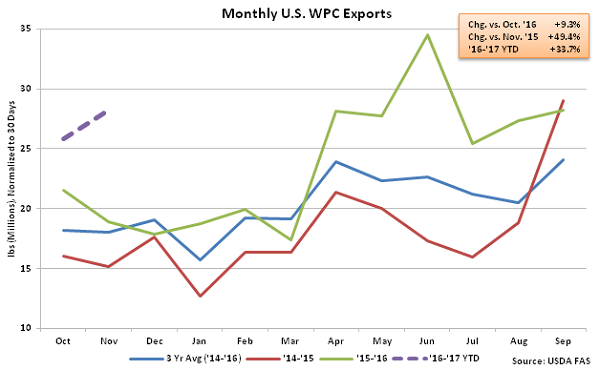
 WPC – Export Volumes Finish Higher on a YOY Basis for the 15th Time in the Past 16 Months
Nov ’16 whey protein concentrate (WPC) export volumes increased 9.3% MOM on a daily average basis while also remaining higher on a YOY basis for the 15th time in the past 16 months, increasing by 49.4%. U.S. WPC export volumes increased to a record seasonal high, finishing 56.1% above three year average figures for the month of November. ’15-’16 annual WPC export volumes finished at a record high annual level while ’16-’17 YTD figures are up an additional 33.7% throughout the first two month of the production season.
WPC – Export Volumes Finish Higher on a YOY Basis for the 15th Time in the Past 16 Months
Nov ’16 whey protein concentrate (WPC) export volumes increased 9.3% MOM on a daily average basis while also remaining higher on a YOY basis for the 15th time in the past 16 months, increasing by 49.4%. U.S. WPC export volumes increased to a record seasonal high, finishing 56.1% above three year average figures for the month of November. ’15-’16 annual WPC export volumes finished at a record high annual level while ’16-’17 YTD figures are up an additional 33.7% throughout the first two month of the production season.
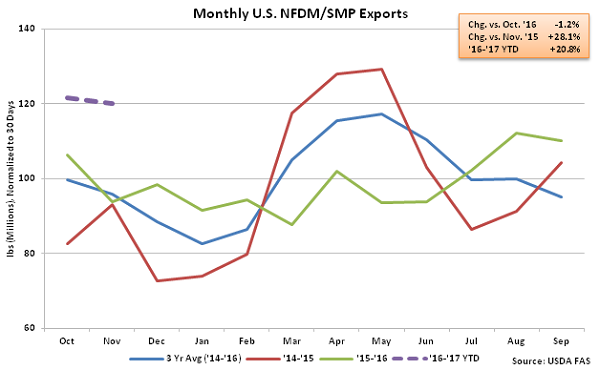
 NFDM/SMP – Export Volumes Increase on a YOY Basis for the Fifth Consecutive Month, up 28.1%
U.S. export volumes of nonfat dry milk (NFDM) and skim milk powder (SMP) declined 1.2% MOM on a daily average basis but remained higher on a YOY basis for the fifth consecutive month, finishing up 28.1% YOY. U.S. NFDM/SMP prices remained below international averages prices for the 23rd consecutive month during Nov ’16, trading at a 14.5% discount to average Oceania and EU-28 prices throughout the month.
U.S. NFDM/SMP export volumes remained significantly higher on a YOY basis despite volumes destined to Mexico increasing by just 3.5% throughout the month. U.S. NFDM/SMP export volumes destined to Mexico accounted for over 40% of all NFDM/SMP volumes shipped throughout the month. Export volumes destined to all other regions increased 52.7% YOY, led by increases in product destined to the Philippines, Indonesia and Vietnam.
NFDM/SMP – Export Volumes Increase on a YOY Basis for the Fifth Consecutive Month, up 28.1%
U.S. export volumes of nonfat dry milk (NFDM) and skim milk powder (SMP) declined 1.2% MOM on a daily average basis but remained higher on a YOY basis for the fifth consecutive month, finishing up 28.1% YOY. U.S. NFDM/SMP prices remained below international averages prices for the 23rd consecutive month during Nov ’16, trading at a 14.5% discount to average Oceania and EU-28 prices throughout the month.
U.S. NFDM/SMP export volumes remained significantly higher on a YOY basis despite volumes destined to Mexico increasing by just 3.5% throughout the month. U.S. NFDM/SMP export volumes destined to Mexico accounted for over 40% of all NFDM/SMP volumes shipped throughout the month. Export volumes destined to all other regions increased 52.7% YOY, led by increases in product destined to the Philippines, Indonesia and Vietnam.
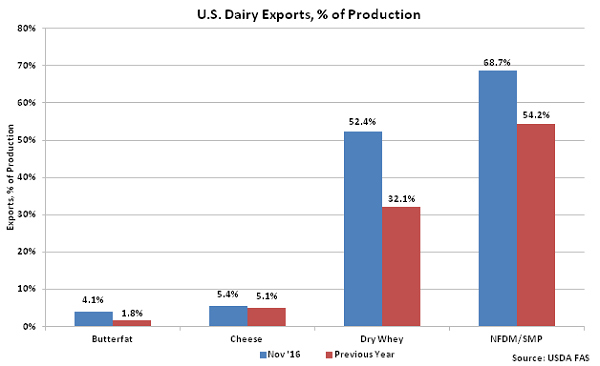
 U.S. butterfat, cheese, dry whey and NFDM/SMP export volumes as a percentage of production finished higher than the previous year during Nov ’16. Dry whey export volumes as a percentage of production increased most significantly on a YOY basis during Nov ’16, followed by NFDM/SMP export volumes.
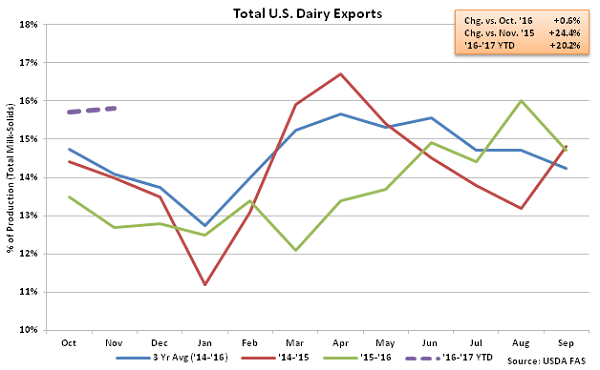
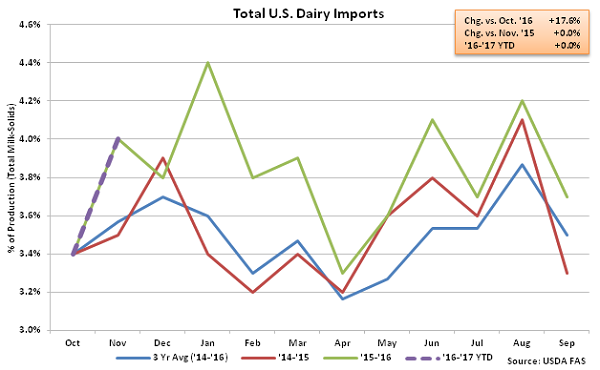
 Overall, U.S. dairy export volumes were equivalent to 15.8% of total U.S. milk solids production during Nov ’16, while dairy import volumes were equivalent to 4.0% of total U.S. milk solids production. Net dairy trade finished at the second highest value experienced throughout the past 18 months during Nov ’16, trailing only the Oct ’16 figure.
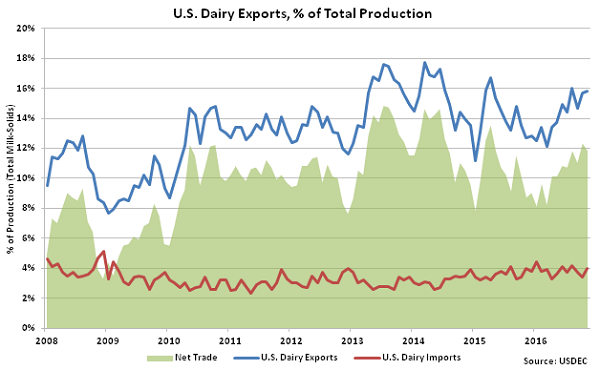 Nov ’16 U.S. dairy exports as a percentage of production increased 0.6% MOM and 24.4% YOY, finishing higher on a YOY basis for the second consecutive month. ’15-’16 annual dairy exports as a percentage of production declined 3.8% YOY to a four year low but are up 20.2% throughout the first two months of the ’16-’17 production season.
 Nov ’16 U.S. dairy imports as a percentage of production finished 17.6% above the previous month and flat on a YOY basis. ’15-’16 annual dairy imports as a percentage of production increased 8.3% YOY, finishing at an eight year high.
 Net trade of U.S. NFDM/SMP and dry whey continues to outpace that of cheese and butter as dry product import volumes remain minimal. U.S. cheese imports offset over three quarters of total export volumes throughout the month while butter import volumes continued to exceed export volumes.
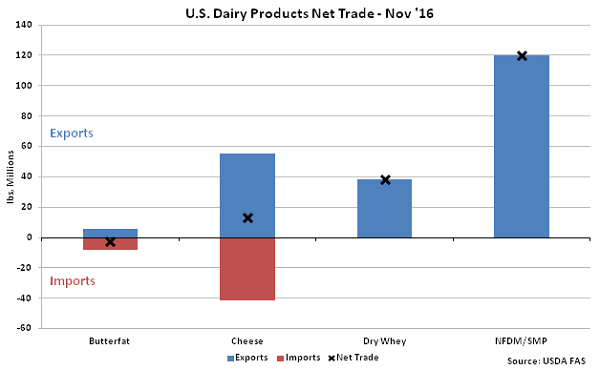
- The U.S. remained a net importer of butter for the 22nd consecutive month during Nov ’16, despite export volumes increasing on a YOY basis for the third consecutive month.
- U.S. dry whey and NFDM/SMP export volumes each increased on a YOY basis for the fifth consecutive month throughout Nov ’16 while U.S. whey protein concentrate export volumes finished higher on a YOY basis for the 15th time in the past 16 months.
- Net dairy trade on a percentage of total U.S. milk solids production basis finished at the second highest value experienced throughout the past 18 months during Nov ’16, trailing only the Oct ’16 figure.
’15-’16 annual U.S. butterfat imports increased 27.1% YOY, finishing at a new record high, while butterfat export volumes declined 23.9% YOY over the same period. Growth in butterfat imports over the past 12 months has been led by product shipped from New Zealand, followed closely by imports of butterfat from Mexico and Ireland.
Cheese – Export Volumes Finish Higher on a YOY Basis Despite Weak Cheddar Demand
Nov ’16 U.S. cheese export volumes increased 4.0% MOM on a daily average basis while also finishing 9.7% higher on a YOY basis. The YOY increase in cheese export volumes was only the third experienced throughout the past two years. The YOY increase in cheese export volumes occurred despite cheddar cheese export volumes declining by 12.4% throughout the month. Other-than-cheddar cheese export volumes increased 12.4% YOY throughout the month, more than offsetting the weak cheddar cheese demand. Despite finishing higher on a YOY basis, Nov ’16 cheese export volumes remained 0.9% below three year average figures for the month of November.
Nov ’16 YOY increases in cheese export volumes were led by product destined to Mexico (+39.3%) and South Korea (+12.4%), which more than offset a 3.7% decline in export volumes destined to Japan. Cheese volumes destined to Mexico, South Korea and Japan accounted for over half of the total U.S. cheese shipments throughout the month.
Dry Whey – Export Volumes Increase on a YOY Basis for the Fifth Consecutive Month, up 51.8%
Nov ’16 U.S. dry whey export volumes declined 7.5% MOM on a daily average basis but remained significantly higher on a YOY basis, finishing up 51.8%. U.S. dry whey export volumes have increased on a YOY basis over five consecutive months through November. YOY increases in dry whey export volumes continue to be led by product destined to China, which increased by 266.6% throughout the month. Dry whey export volume destined to China accounted for over a third of all dry whey volumes shipped throughout the month.
WPC – Export Volumes Finish Higher on a YOY Basis for the 15th Time in the Past 16 Months
Nov ’16 whey protein concentrate (WPC) export volumes increased 9.3% MOM on a daily average basis while also remaining higher on a YOY basis for the 15th time in the past 16 months, increasing by 49.4%. U.S. WPC export volumes increased to a record seasonal high, finishing 56.1% above three year average figures for the month of November. ’15-’16 annual WPC export volumes finished at a record high annual level while ’16-’17 YTD figures are up an additional 33.7% throughout the first two month of the production season.
NFDM/SMP – Export Volumes Increase on a YOY Basis for the Fifth Consecutive Month, up 28.1%
U.S. export volumes of nonfat dry milk (NFDM) and skim milk powder (SMP) declined 1.2% MOM on a daily average basis but remained higher on a YOY basis for the fifth consecutive month, finishing up 28.1% YOY. U.S. NFDM/SMP prices remained below international averages prices for the 23rd consecutive month during Nov ’16, trading at a 14.5% discount to average Oceania and EU-28 prices throughout the month.
U.S. NFDM/SMP export volumes remained significantly higher on a YOY basis despite volumes destined to Mexico increasing by just 3.5% throughout the month. U.S. NFDM/SMP export volumes destined to Mexico accounted for over 40% of all NFDM/SMP volumes shipped throughout the month. Export volumes destined to all other regions increased 52.7% YOY, led by increases in product destined to the Philippines, Indonesia and Vietnam.
U.S. butterfat, cheese, dry whey and NFDM/SMP export volumes as a percentage of production finished higher than the previous year during Nov ’16. Dry whey export volumes as a percentage of production increased most significantly on a YOY basis during Nov ’16, followed by NFDM/SMP export volumes.
Overall, U.S. dairy export volumes were equivalent to 15.8% of total U.S. milk solids production during Nov ’16, while dairy import volumes were equivalent to 4.0% of total U.S. milk solids production. Net dairy trade finished at the second highest value experienced throughout the past 18 months during Nov ’16, trailing only the Oct ’16 figure.
Nov ’16 U.S. dairy exports as a percentage of production increased 0.6% MOM and 24.4% YOY, finishing higher on a YOY basis for the second consecutive month. ’15-’16 annual dairy exports as a percentage of production declined 3.8% YOY to a four year low but are up 20.2% throughout the first two months of the ’16-’17 production season.
Nov ’16 U.S. dairy imports as a percentage of production finished 17.6% above the previous month and flat on a YOY basis. ’15-’16 annual dairy imports as a percentage of production increased 8.3% YOY, finishing at an eight year high.
Net trade of U.S. NFDM/SMP and dry whey continues to outpace that of cheese and butter as dry product import volumes remain minimal. U.S. cheese imports offset over three quarters of total export volumes throughout the month while butter import volumes continued to exceed export volumes.