U.S. Dairy Commercial Disappearance Update – Jan ’17
Executive Summary
U.S. dairy commercial disappearance figures provided by USDA were recently updated with values spanning through Nov ’16. Highlights from the updated report include:
 Butter – Disappearance Reaches a Record Monthly High, Finishes up 5.3% YOY
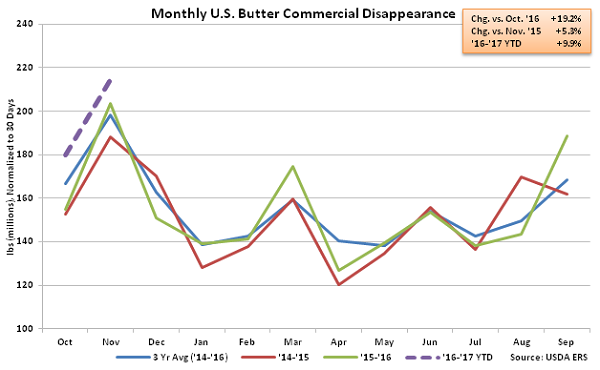
Nov ’16 U.S. butter commercial disappearance increased 19.2% MOM on a daily average basis while also remaining significantly higher on a YOY basis for the third consecutive month, finishing up 5.3%. Overall, butter commercial disappearance finished at a new monthly record high. Nov ’16 domestic butter demand increased 3.8% YOY to a monthly record high while international demand increased 142.2% from the nine year seasonal low experienced during the previous year. ’15-’16 annual U.S. butter disappearance increased 2.2% YOY as a 3.3% increase in domestic demand more than offset a 43.7% decline in export volumes. ’16-’17 YTD U.S. butter disappearance is up an additional 9.9% throughout the first two months of the production season.
Butter – Disappearance Reaches a Record Monthly High, Finishes up 5.3% YOY
Nov ’16 U.S. butter commercial disappearance increased 19.2% MOM on a daily average basis while also remaining significantly higher on a YOY basis for the third consecutive month, finishing up 5.3%. Overall, butter commercial disappearance finished at a new monthly record high. Nov ’16 domestic butter demand increased 3.8% YOY to a monthly record high while international demand increased 142.2% from the nine year seasonal low experienced during the previous year. ’15-’16 annual U.S. butter disappearance increased 2.2% YOY as a 3.3% increase in domestic demand more than offset a 43.7% decline in export volumes. ’16-’17 YTD U.S. butter disappearance is up an additional 9.9% throughout the first two months of the production season.
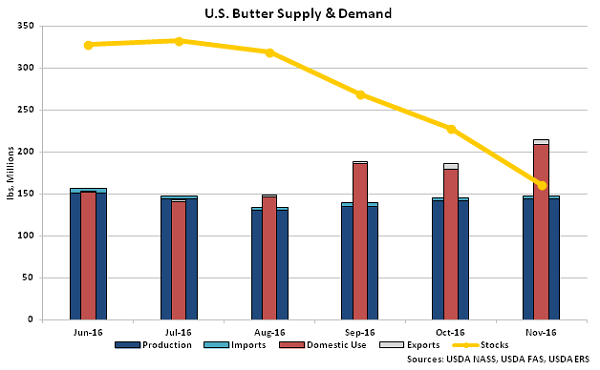
 Nov ’16 U.S. butter disappearance figures outpaced production and import volumes, resulting in the fourth consecutive monthly decline in stocks. Butter stocks typically decline seasonally until lows are reached during the month of November.
 Cheese – Disappearance Reaches a Record Monthly High, Finishes up 6.1% YOY
Nov ’16 U.S. cheese commercial disappearance increased 3.7% MOM on a daily average basis and 6.1% YOY, finishing at a new monthly record high. YOY increases in cheese disappearance have been exhibited over 17 consecutive months through Nov ’16. American cheese disappearance was particularly strong, increasing by 9.7%, while other-than-American cheese disappearance finished up 4.0% throughout the month. Domestic cheese demand increased on a YOY basis for the 27th consecutive month, finishing 6.0% above the previous year, while export demand increased 9.7% throughout the month, finishing higher on a YOY basis for the third time in the past four months. Domestic cheese disappearance increased 3.7% throughout the ’15-’16 production season, more than offsetting a 14.0% decline in export demand. American cheese disappearance increased just 0.2% throughout the ’15-’16 production season however other-than-American cheese disappearance finished 4.2% higher over the period. ’16-’17 YTD cheese disappearance is up an additional 3.7% throughout the first two months of the production season.
Cheese – Disappearance Reaches a Record Monthly High, Finishes up 6.1% YOY
Nov ’16 U.S. cheese commercial disappearance increased 3.7% MOM on a daily average basis and 6.1% YOY, finishing at a new monthly record high. YOY increases in cheese disappearance have been exhibited over 17 consecutive months through Nov ’16. American cheese disappearance was particularly strong, increasing by 9.7%, while other-than-American cheese disappearance finished up 4.0% throughout the month. Domestic cheese demand increased on a YOY basis for the 27th consecutive month, finishing 6.0% above the previous year, while export demand increased 9.7% throughout the month, finishing higher on a YOY basis for the third time in the past four months. Domestic cheese disappearance increased 3.7% throughout the ’15-’16 production season, more than offsetting a 14.0% decline in export demand. American cheese disappearance increased just 0.2% throughout the ’15-’16 production season however other-than-American cheese disappearance finished 4.2% higher over the period. ’16-’17 YTD cheese disappearance is up an additional 3.7% throughout the first two months of the production season.
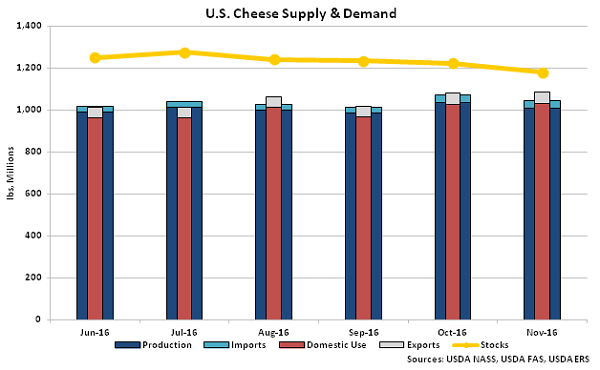
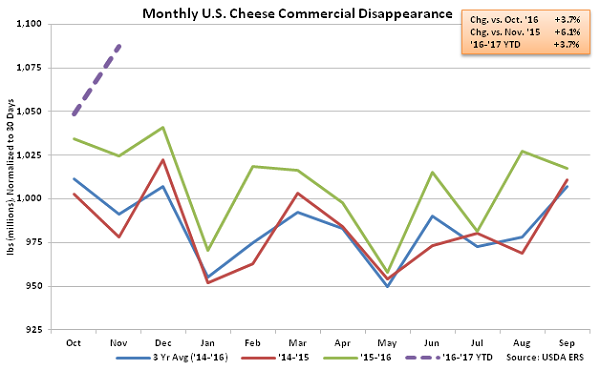 Nov ’16 U.S. cheese disappearance figures outpaced production and import volumes, resulting in the fourth consecutive monthly decline in stocks.
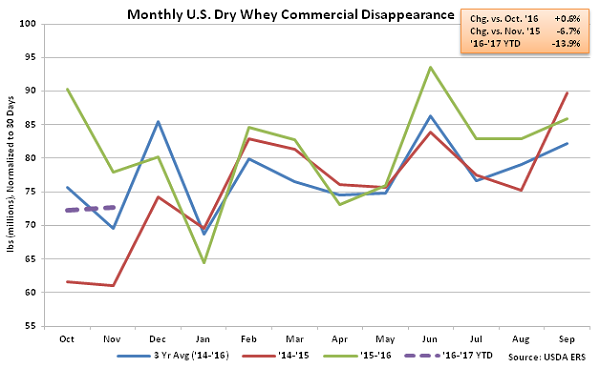
 Dry Whey – Disappearance Remains Lower on a YOY Basis, Finishes Down 6.7%
Nov ’16 U.S. dry whey commercial disappearanceincreased 0.6% MOM on a daily average basis but remained lower on a YOY basis for the third consecutive month, declining by 6.7%. Domestic dry whey demand declined 34.9% throughout the month, more than offsetting a 51.8% increase in export volumes. Domestic dry whey demand has declined on a YOY basis over four consecutive months through November, finishing 30.9% lower over the period. ’15-’16 annual U.S. dry whey disappearance finished up 7.3% YOY as domestic demand increased to an eight year high. ’16-’17 YTD dry whey disappearance has declined by 13.9% throughout the first two months of the production season, however.
Dry Whey – Disappearance Remains Lower on a YOY Basis, Finishes Down 6.7%
Nov ’16 U.S. dry whey commercial disappearanceincreased 0.6% MOM on a daily average basis but remained lower on a YOY basis for the third consecutive month, declining by 6.7%. Domestic dry whey demand declined 34.9% throughout the month, more than offsetting a 51.8% increase in export volumes. Domestic dry whey demand has declined on a YOY basis over four consecutive months through November, finishing 30.9% lower over the period. ’15-’16 annual U.S. dry whey disappearance finished up 7.3% YOY as domestic demand increased to an eight year high. ’16-’17 YTD dry whey disappearance has declined by 13.9% throughout the first two months of the production season, however.
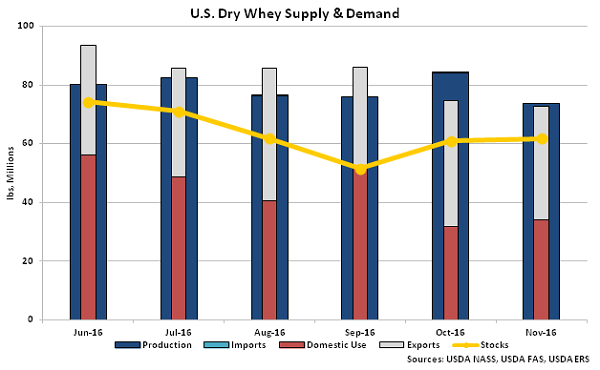
 Nov ’16 U.S. dry whey production and import volumes outpaced total disappearance figures, resulting in the second consecutive increase in stocks.
 WPC – Disappearance Remains Significantly Lower on a YOY Basis, Finishes Down 15.9%
Nov ’16 U.S. whey protein concentrate (WPC) commercial disappearance increased 10.7% MOM on a daily average basis from the three and a half year low experienced during the previous month but remained lower on a YOY basis, declining by 15.9%. WPC export volumes increased on a YOY basis for the 15th time in the past 16 months, finishing up 49.4%, however the increase in export volumes was more than offset by a 58.3% YOY decline in domestic demand. ’15-’16 annual U.S. WPC disappearance increased by 0.8% as export demand finished at a record annual high, however domestic demand declined by 20.0% YOY over the period. ’16-’17 YTD WPC disappearance has declined by 24.3% throughout the first two months of the production season as domestic demand has remained weak.
WPC – Disappearance Remains Significantly Lower on a YOY Basis, Finishes Down 15.9%
Nov ’16 U.S. whey protein concentrate (WPC) commercial disappearance increased 10.7% MOM on a daily average basis from the three and a half year low experienced during the previous month but remained lower on a YOY basis, declining by 15.9%. WPC export volumes increased on a YOY basis for the 15th time in the past 16 months, finishing up 49.4%, however the increase in export volumes was more than offset by a 58.3% YOY decline in domestic demand. ’15-’16 annual U.S. WPC disappearance increased by 0.8% as export demand finished at a record annual high, however domestic demand declined by 20.0% YOY over the period. ’16-’17 YTD WPC disappearance has declined by 24.3% throughout the first two months of the production season as domestic demand has remained weak.
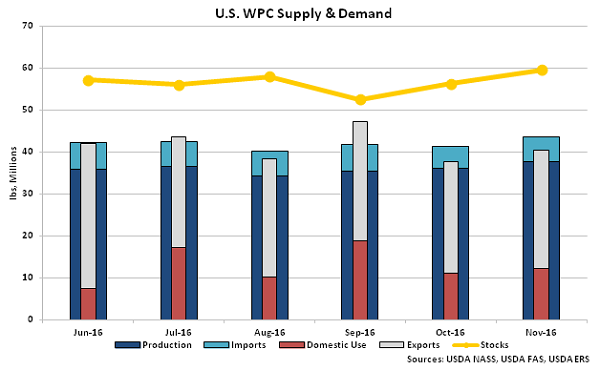
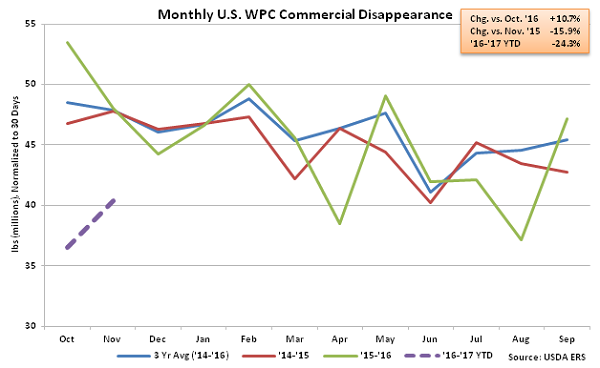 Nov ’16 U.S. WPC production and import volumes outpaced total disappearance figures for the third time in the past four months, resulting in stocks increasing to a seven month high.
 NFDM/SMP – Disappearance Increases to a Record Seasonal High, Finishes up 18.8%
Nov ’16 U.S. nonfat dry milk (NFDM) and skim milk powder (SMP) commercial disappearance increased 9.1% MOM on a daily average basis and 18.8% YOY, finishing at a record seasonal high for the month of November. U.S. NFDM/SMP domestic disappearance increased 4.5% YOY throughout the month while export volumes remained strong, finishing up 28.1% YOY. ’15-’16 annual U.S. NFDM/SMP disappearance declined 0.7% YOY as a 3.8% decline in domestic demand more than offset a 2.2% increase in export volumes. ’16-’17 YTD NFDM/SMP disappearance has rebounded by 4.1% throughout the first two months of the production season.
NFDM/SMP – Disappearance Increases to a Record Seasonal High, Finishes up 18.8%
Nov ’16 U.S. nonfat dry milk (NFDM) and skim milk powder (SMP) commercial disappearance increased 9.1% MOM on a daily average basis and 18.8% YOY, finishing at a record seasonal high for the month of November. U.S. NFDM/SMP domestic disappearance increased 4.5% YOY throughout the month while export volumes remained strong, finishing up 28.1% YOY. ’15-’16 annual U.S. NFDM/SMP disappearance declined 0.7% YOY as a 3.8% decline in domestic demand more than offset a 2.2% increase in export volumes. ’16-’17 YTD NFDM/SMP disappearance has rebounded by 4.1% throughout the first two months of the production season.
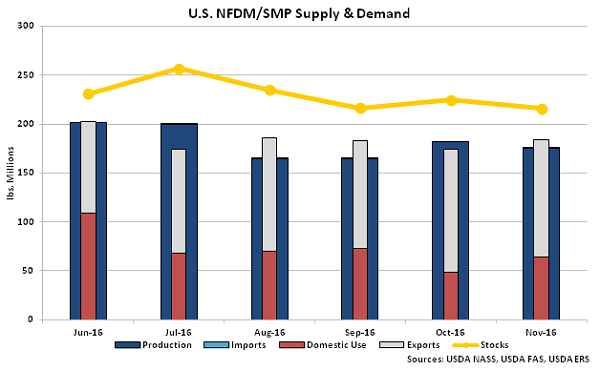
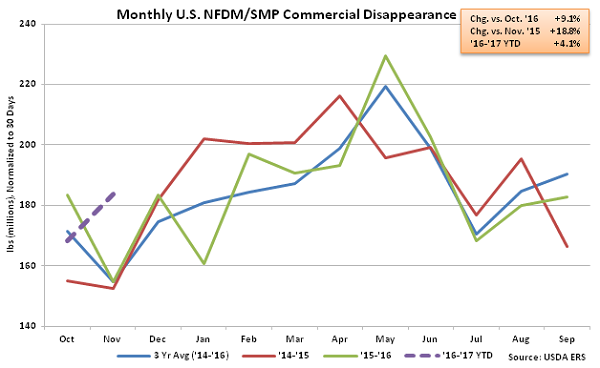 Nov ’16 U.S. NFDM/SMP disappearance figures outpaced production and import volumes, resulting in stocks declining to an 11 month low.
 Fluid Milk Sales – Total Milk Sales Decline YOY for the First Time in Three Months, Finish Down 3.5%
Oct ’16 U.S. fluid milk sales of 4.18 billion pounds declined 2.1% MOM on a daily average basis while also finishing lower on a YOY basis for the first time in three months, declining by 3.5%. Sales of whole milk increased on a YOY basis for the 23rd consecutive month, finishing up 1.3%, however fat-free milk sales declined 13.7% YOY throughout the month. ’15-’16 annual U.S. total fluid milk sales declined to a record low for the sixth consecutive year, finished down 0.8% YOY. Annual whole milk sales finished up 6.1% however annual fat-free milk sales declined 11.3% throughout the year.
Fluid Milk Sales – Total Milk Sales Decline YOY for the First Time in Three Months, Finish Down 3.5%
Oct ’16 U.S. fluid milk sales of 4.18 billion pounds declined 2.1% MOM on a daily average basis while also finishing lower on a YOY basis for the first time in three months, declining by 3.5%. Sales of whole milk increased on a YOY basis for the 23rd consecutive month, finishing up 1.3%, however fat-free milk sales declined 13.7% YOY throughout the month. ’15-’16 annual U.S. total fluid milk sales declined to a record low for the sixth consecutive year, finished down 0.8% YOY. Annual whole milk sales finished up 6.1% however annual fat-free milk sales declined 11.3% throughout the year.
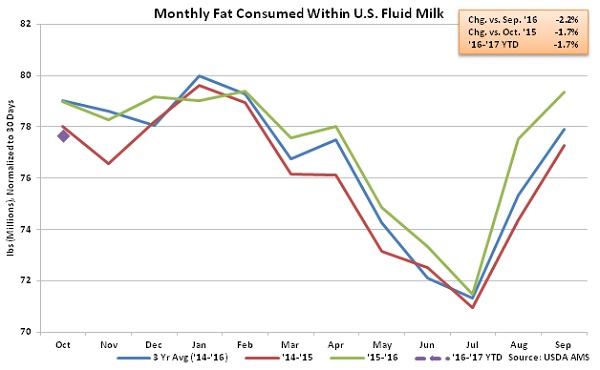
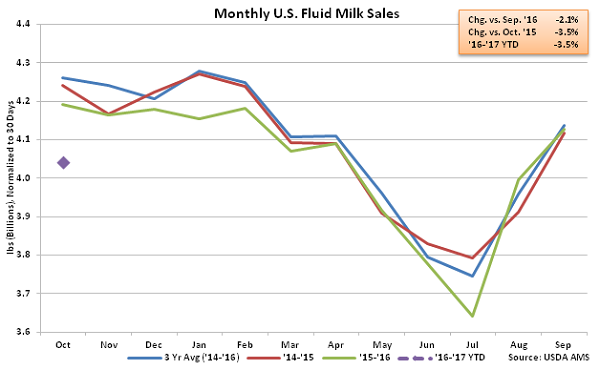 Fat consumed within U.S. fluid milk declined on a YOY basis for the first time in nine months during Oct ’16, finishing down 1.7%. Declines in fat consumed within reduced fat and low-fat milk more than offset an increase in fat consumed within whole milk throughout the month. Total fat consumed within U.S. fluid milk finished up 1.6% YOY throughout the ’15-’16 production season.
 Overall, Nov ’16 domestic commercial disappearance increased most significantly on a YOY basis for cheese, while international disappearance finished most significantly higher for butter throughout the month.
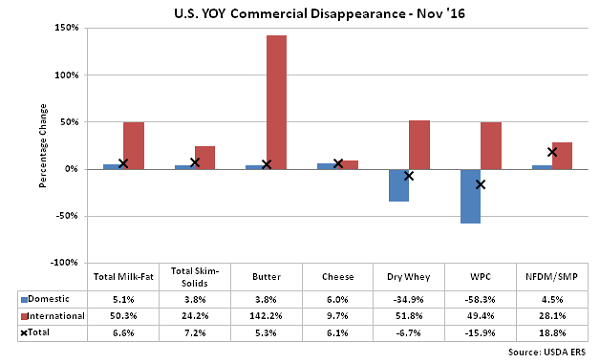
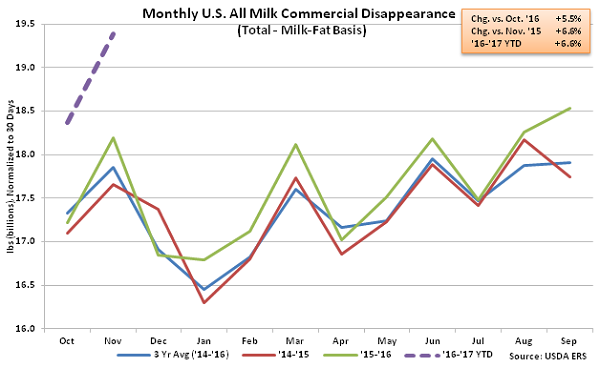
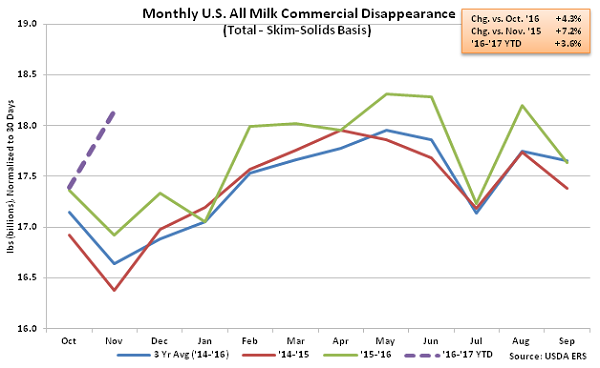
- Nov ’16 U.S. commercial disappearance for milk used in all products finished at record high seasonal levels for the month of November on both a milk-fat and skim-solids basis as domestic demand and export volumes remained strong.
- Nov ’16 commercial disappearance of butter and cheese each reached new monthly record high levels throughout the month. Dry whey and whey protein concentrate disappearance remained lower on a YOY basis during Nov ’16 however nonfat dry milk disappearance rebounded to a record seasonal high for the month of November.
- U.S. fluid milk sales declined on a YOY basis for the first time in three months during Oct ’16, finishing down 3.5%. Sales of whole milk increased on a YOY basis for the 23rd consecutive month during Oct ’16, however skim milk sales remained weak, declining by 13.7%.
Butter – Disappearance Reaches a Record Monthly High, Finishes up 5.3% YOY
Nov ’16 U.S. butter commercial disappearance increased 19.2% MOM on a daily average basis while also remaining significantly higher on a YOY basis for the third consecutive month, finishing up 5.3%. Overall, butter commercial disappearance finished at a new monthly record high. Nov ’16 domestic butter demand increased 3.8% YOY to a monthly record high while international demand increased 142.2% from the nine year seasonal low experienced during the previous year. ’15-’16 annual U.S. butter disappearance increased 2.2% YOY as a 3.3% increase in domestic demand more than offset a 43.7% decline in export volumes. ’16-’17 YTD U.S. butter disappearance is up an additional 9.9% throughout the first two months of the production season.
Nov ’16 U.S. butter disappearance figures outpaced production and import volumes, resulting in the fourth consecutive monthly decline in stocks. Butter stocks typically decline seasonally until lows are reached during the month of November.
Cheese – Disappearance Reaches a Record Monthly High, Finishes up 6.1% YOY
Nov ’16 U.S. cheese commercial disappearance increased 3.7% MOM on a daily average basis and 6.1% YOY, finishing at a new monthly record high. YOY increases in cheese disappearance have been exhibited over 17 consecutive months through Nov ’16. American cheese disappearance was particularly strong, increasing by 9.7%, while other-than-American cheese disappearance finished up 4.0% throughout the month. Domestic cheese demand increased on a YOY basis for the 27th consecutive month, finishing 6.0% above the previous year, while export demand increased 9.7% throughout the month, finishing higher on a YOY basis for the third time in the past four months. Domestic cheese disappearance increased 3.7% throughout the ’15-’16 production season, more than offsetting a 14.0% decline in export demand. American cheese disappearance increased just 0.2% throughout the ’15-’16 production season however other-than-American cheese disappearance finished 4.2% higher over the period. ’16-’17 YTD cheese disappearance is up an additional 3.7% throughout the first two months of the production season.
Nov ’16 U.S. cheese disappearance figures outpaced production and import volumes, resulting in the fourth consecutive monthly decline in stocks.
Dry Whey – Disappearance Remains Lower on a YOY Basis, Finishes Down 6.7%
Nov ’16 U.S. dry whey commercial disappearanceincreased 0.6% MOM on a daily average basis but remained lower on a YOY basis for the third consecutive month, declining by 6.7%. Domestic dry whey demand declined 34.9% throughout the month, more than offsetting a 51.8% increase in export volumes. Domestic dry whey demand has declined on a YOY basis over four consecutive months through November, finishing 30.9% lower over the period. ’15-’16 annual U.S. dry whey disappearance finished up 7.3% YOY as domestic demand increased to an eight year high. ’16-’17 YTD dry whey disappearance has declined by 13.9% throughout the first two months of the production season, however.
Nov ’16 U.S. dry whey production and import volumes outpaced total disappearance figures, resulting in the second consecutive increase in stocks.
WPC – Disappearance Remains Significantly Lower on a YOY Basis, Finishes Down 15.9%
Nov ’16 U.S. whey protein concentrate (WPC) commercial disappearance increased 10.7% MOM on a daily average basis from the three and a half year low experienced during the previous month but remained lower on a YOY basis, declining by 15.9%. WPC export volumes increased on a YOY basis for the 15th time in the past 16 months, finishing up 49.4%, however the increase in export volumes was more than offset by a 58.3% YOY decline in domestic demand. ’15-’16 annual U.S. WPC disappearance increased by 0.8% as export demand finished at a record annual high, however domestic demand declined by 20.0% YOY over the period. ’16-’17 YTD WPC disappearance has declined by 24.3% throughout the first two months of the production season as domestic demand has remained weak.
Nov ’16 U.S. WPC production and import volumes outpaced total disappearance figures for the third time in the past four months, resulting in stocks increasing to a seven month high.
NFDM/SMP – Disappearance Increases to a Record Seasonal High, Finishes up 18.8%
Nov ’16 U.S. nonfat dry milk (NFDM) and skim milk powder (SMP) commercial disappearance increased 9.1% MOM on a daily average basis and 18.8% YOY, finishing at a record seasonal high for the month of November. U.S. NFDM/SMP domestic disappearance increased 4.5% YOY throughout the month while export volumes remained strong, finishing up 28.1% YOY. ’15-’16 annual U.S. NFDM/SMP disappearance declined 0.7% YOY as a 3.8% decline in domestic demand more than offset a 2.2% increase in export volumes. ’16-’17 YTD NFDM/SMP disappearance has rebounded by 4.1% throughout the first two months of the production season.
Nov ’16 U.S. NFDM/SMP disappearance figures outpaced production and import volumes, resulting in stocks declining to an 11 month low.
Fluid Milk Sales – Total Milk Sales Decline YOY for the First Time in Three Months, Finish Down 3.5%
Oct ’16 U.S. fluid milk sales of 4.18 billion pounds declined 2.1% MOM on a daily average basis while also finishing lower on a YOY basis for the first time in three months, declining by 3.5%. Sales of whole milk increased on a YOY basis for the 23rd consecutive month, finishing up 1.3%, however fat-free milk sales declined 13.7% YOY throughout the month. ’15-’16 annual U.S. total fluid milk sales declined to a record low for the sixth consecutive year, finished down 0.8% YOY. Annual whole milk sales finished up 6.1% however annual fat-free milk sales declined 11.3% throughout the year.
Fat consumed within U.S. fluid milk declined on a YOY basis for the first time in nine months during Oct ’16, finishing down 1.7%. Declines in fat consumed within reduced fat and low-fat milk more than offset an increase in fat consumed within whole milk throughout the month. Total fat consumed within U.S. fluid milk finished up 1.6% YOY throughout the ’15-’16 production season.
Overall, Nov ’16 domestic commercial disappearance increased most significantly on a YOY basis for cheese, while international disappearance finished most significantly higher for butter throughout the month.