U.S. Milk Production Update – Feb ’17
Executive Summary
U.S. milk production figures provided by USDA were recently updated with values spanning through Jan ’17. Highlights from the updated report include:
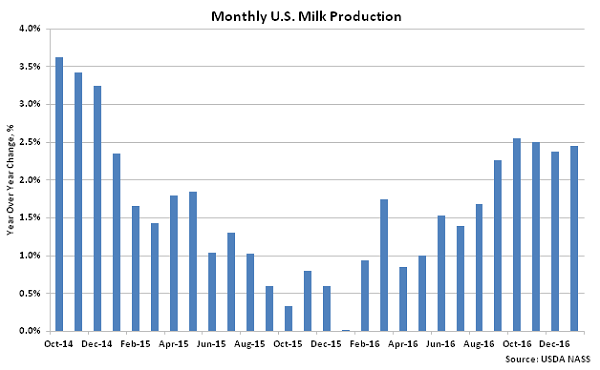
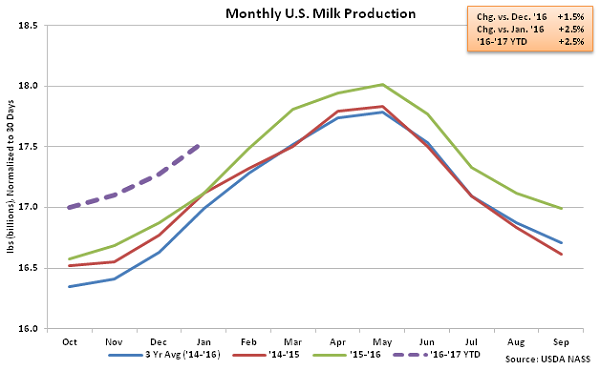 U.S. milk production remained significantly higher on a YOY basis throughout the final months of 2014, however production growth decelerated over the majority of 2015. The growth rate in U.S. milk production has once again accelerated over recent months, however, as the Jan ’17 YOY growth rate of 2.5% was the third largest experienced throughout the past 24 months on a percentage basis, trailing only the Oct ’16 and Nov ’16 growth rates by less than 0.1%. Overall, U.S. milk production is up 2.5% throughout the first third of the ’16-’17 production season.
 YOY production gains on a percentage basis were led by Texas (+19.2%), followed by New Mexico (+15.3%) and Kansas (+8.5%). California milk production declined on a YOY basis for the first time in four months, finishing down 0.6%, while production also finished lower on a YOY basis throughout Oregon, Florida, Virginia, Ohio and Washington.
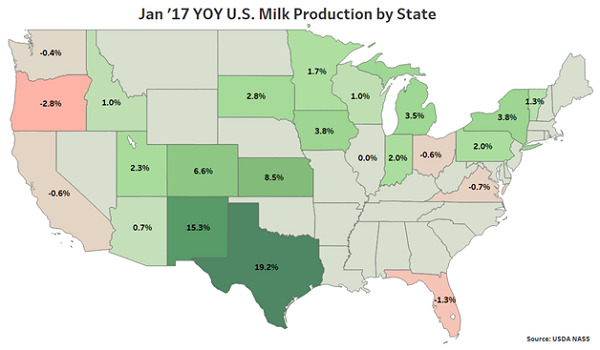 Other than California, each of the nine largest milk producing states experienced YOY gains in production throughout Jan ’17. Milk production within the top ten milk producing states finished higher by a weighted average of 3.2% throughout the month. The aforementioned states accounted for over 70% of the total U.S. milk production experienced throughout the month.
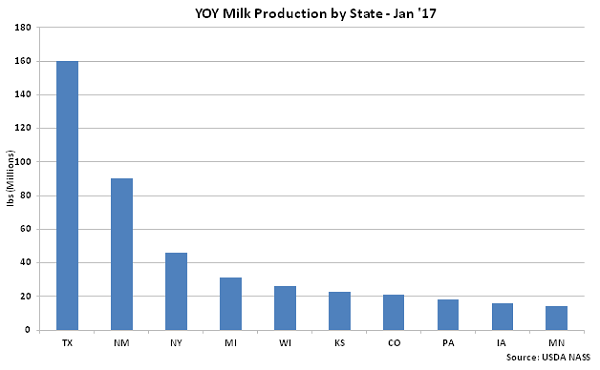
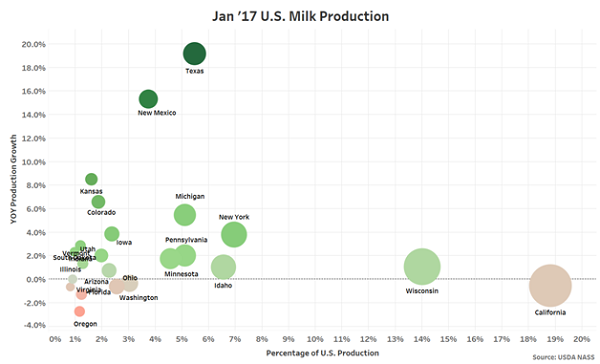 YOY production gains on an absolute basis continue to be led by Texas, followed by New Mexico. Combined milk production within Texas and New Mexico declined by 9.0% on a YOY basis during January of the previous year as effects from Winter Storm Goliath were experienced. Texas and New Mexico combined to account for nearly 58% of the total YOY gain in U.S. milk production.
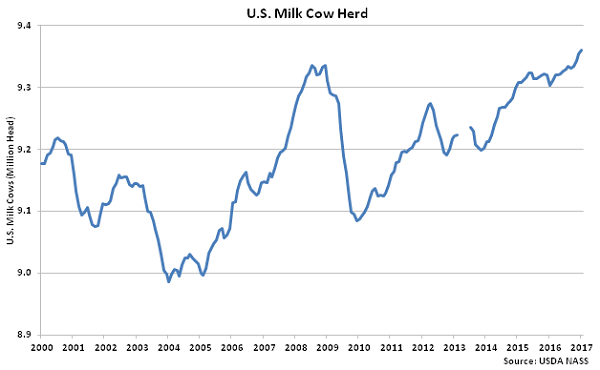
 Overall, the U.S. milk cow herd increased 6,000 head during Jan ’17, finishing at the highest figure experienced throughout the past 20 years. The total U.S. milk cow herd currently stands at 9.36 million head, which is 56,000 head more than January of last year.
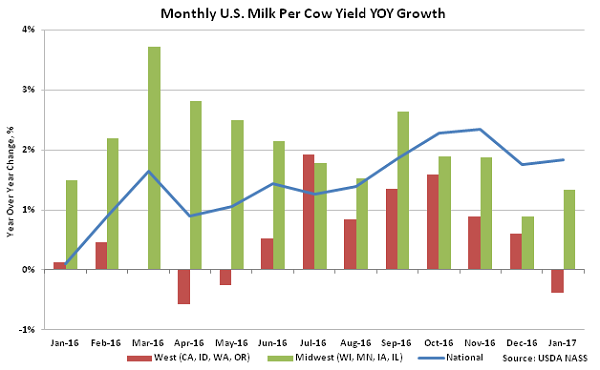
 The U.S. milk per cow yield increased YOY for the 15th consecutive month, finishing 1.8% above the previous year. The YOY increase in milk per cow yields was the second lowest experienced throughout the past five months on a percentage basis, however, as Western yields fell below previous year levels.Milk per cow yields declined by an average of 0.4% YOY within California, Idaho, Washington and Oregon. Milk per cow yields continued to remain higher on a YOY basis within the Midwest, however, as yields increased by an average of 1.3% within Wisconsin, Minnesota, Iowa and Illinois.
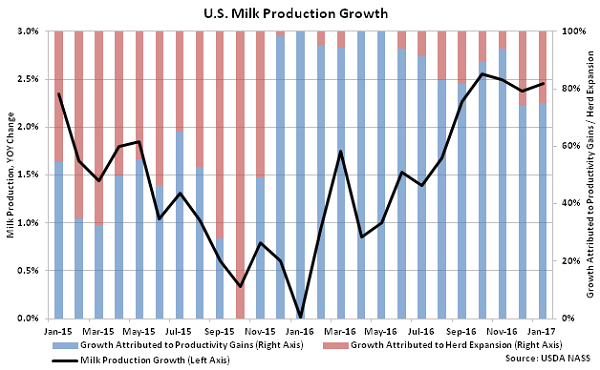
 Gains in milk per cow productivity have continued to account for the majority of the milk production growth experienced throughout Jan ’17. 75% of the increase in milk production was the result of higher productivity per cow during Jan ’17 while growth attributed to herd expansion accounted for just 25% percent of the Jan ’17 milk production growth.
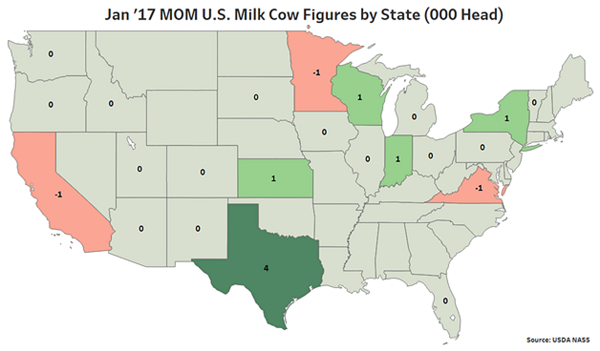
 MOM increases in the milk cow herd were led by Texas (+4,000 head), followed by Wisconsin (+1,000 head), New York (+1,000 head), Indiana (+1,000 head) and Kansas (+1,000 head) while California, Minnesota and Virginia each experienced 1,000 head MOM increases in their milk cow herds throughout the month.
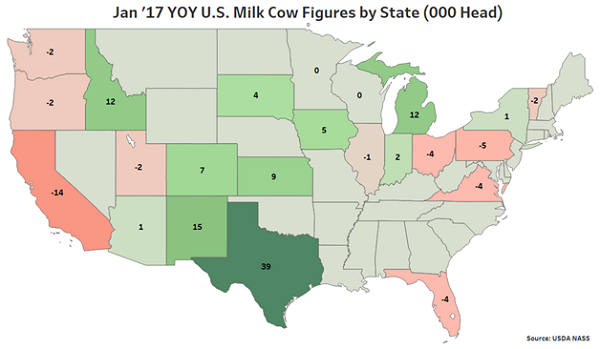
 YOY increases in milk cow herds were led by Texas (+39,000 head), followed by New Mexico (+15,000 head), Idaho (+12,000 head) and Michigan (+12,000 head). California (-14,000 head) experienced the largest YOY reduction in their milk cow herd throughout the month.
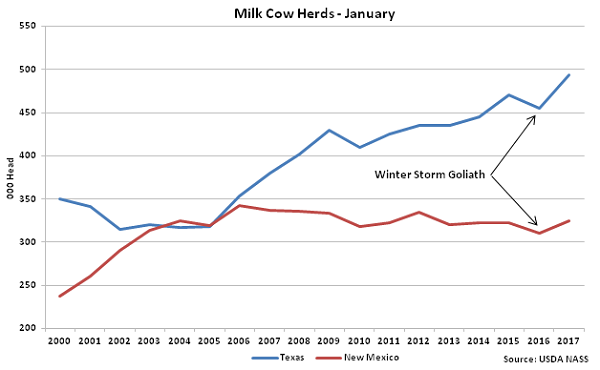
 Jan ’17 YOY increases in the Texas and New Mexico milk cow herds were against depressed levels experienced throughout 2016. The New Mexico milk cow herd declined 13,000 head on a YOY basis during Jan ’16 as effects of Winter Storm Goliath were experienced but rebounded to a five year seasonal high during Jan ’17. The Texas milk cow herd declined by 15,000 head on a YOY basis during Jan ’16 but rebounded to a 54 year seasonal high during Jan ’17 as significant expansion has continued.
- U.S. milk production remained higher on a YOY basis for the 37th consecutive month during Jan ’17, finishing up 2.5% to a new record high seasonal level. U.S. milk production has increased 2.5% YOY throughout the first third of the ’16-’17 production season.
- The U.S. dairy cow herd increased by 6,000 head during Jan ’17, finishing at the highest figure experienced throughout the past 20 years. The total U.S. dairy cow herd currently stands at 9.36 million head, which is 56,000 head more than January of last year.
- U.S. milk per cow yields increased on a YOY basis for the 15th consecutive month during Jan ’17 as growth in Midwestern yields outweighed declining Western yields. Gains in milk per cow yields continued to account for the majority of the milk production growth experienced throughout Jan ’17.
U.S. milk production remained significantly higher on a YOY basis throughout the final months of 2014, however production growth decelerated over the majority of 2015. The growth rate in U.S. milk production has once again accelerated over recent months, however, as the Jan ’17 YOY growth rate of 2.5% was the third largest experienced throughout the past 24 months on a percentage basis, trailing only the Oct ’16 and Nov ’16 growth rates by less than 0.1%. Overall, U.S. milk production is up 2.5% throughout the first third of the ’16-’17 production season.
YOY production gains on a percentage basis were led by Texas (+19.2%), followed by New Mexico (+15.3%) and Kansas (+8.5%). California milk production declined on a YOY basis for the first time in four months, finishing down 0.6%, while production also finished lower on a YOY basis throughout Oregon, Florida, Virginia, Ohio and Washington.
Other than California, each of the nine largest milk producing states experienced YOY gains in production throughout Jan ’17. Milk production within the top ten milk producing states finished higher by a weighted average of 3.2% throughout the month. The aforementioned states accounted for over 70% of the total U.S. milk production experienced throughout the month.
YOY production gains on an absolute basis continue to be led by Texas, followed by New Mexico. Combined milk production within Texas and New Mexico declined by 9.0% on a YOY basis during January of the previous year as effects from Winter Storm Goliath were experienced. Texas and New Mexico combined to account for nearly 58% of the total YOY gain in U.S. milk production.
Overall, the U.S. milk cow herd increased 6,000 head during Jan ’17, finishing at the highest figure experienced throughout the past 20 years. The total U.S. milk cow herd currently stands at 9.36 million head, which is 56,000 head more than January of last year.
The U.S. milk per cow yield increased YOY for the 15th consecutive month, finishing 1.8% above the previous year. The YOY increase in milk per cow yields was the second lowest experienced throughout the past five months on a percentage basis, however, as Western yields fell below previous year levels.Milk per cow yields declined by an average of 0.4% YOY within California, Idaho, Washington and Oregon. Milk per cow yields continued to remain higher on a YOY basis within the Midwest, however, as yields increased by an average of 1.3% within Wisconsin, Minnesota, Iowa and Illinois.
Gains in milk per cow productivity have continued to account for the majority of the milk production growth experienced throughout Jan ’17. 75% of the increase in milk production was the result of higher productivity per cow during Jan ’17 while growth attributed to herd expansion accounted for just 25% percent of the Jan ’17 milk production growth.
MOM increases in the milk cow herd were led by Texas (+4,000 head), followed by Wisconsin (+1,000 head), New York (+1,000 head), Indiana (+1,000 head) and Kansas (+1,000 head) while California, Minnesota and Virginia each experienced 1,000 head MOM increases in their milk cow herds throughout the month.
YOY increases in milk cow herds were led by Texas (+39,000 head), followed by New Mexico (+15,000 head), Idaho (+12,000 head) and Michigan (+12,000 head). California (-14,000 head) experienced the largest YOY reduction in their milk cow herd throughout the month.
Jan ’17 YOY increases in the Texas and New Mexico milk cow herds were against depressed levels experienced throughout 2016. The New Mexico milk cow herd declined 13,000 head on a YOY basis during Jan ’16 as effects of Winter Storm Goliath were experienced but rebounded to a five year seasonal high during Jan ’17. The Texas milk cow herd declined by 15,000 head on a YOY basis during Jan ’16 but rebounded to a 54 year seasonal high during Jan ’17 as significant expansion has continued.