U.S. Milk Production Update – Sep ’19
Executive Summary
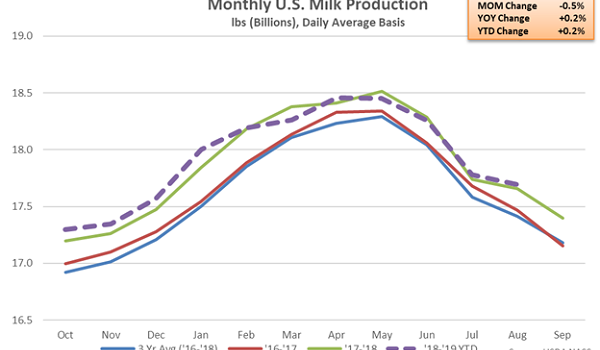
U.S. milk production figures provided by USDA were recently updated with values spanning through Aug ’19. Highlights from the updated report include:
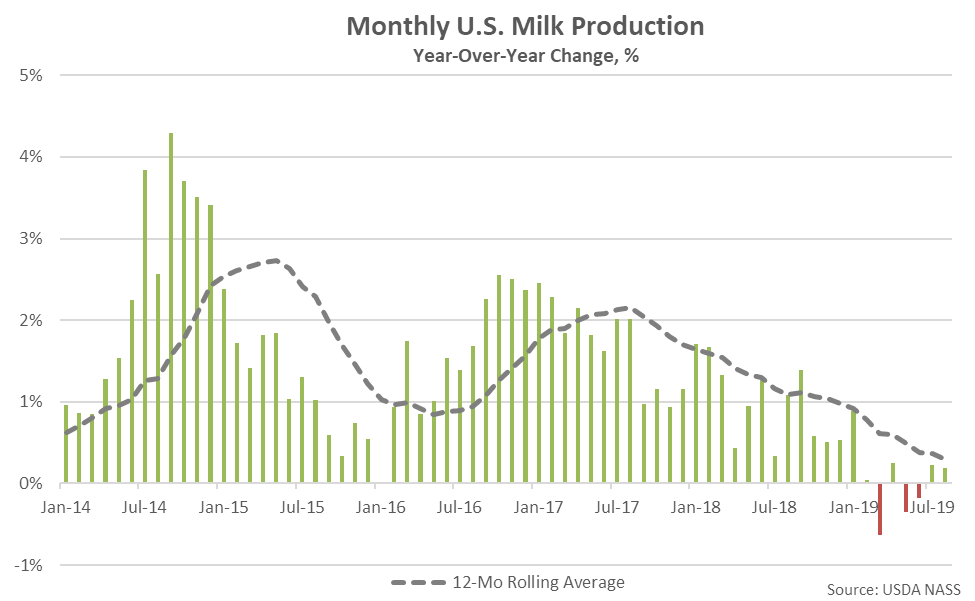
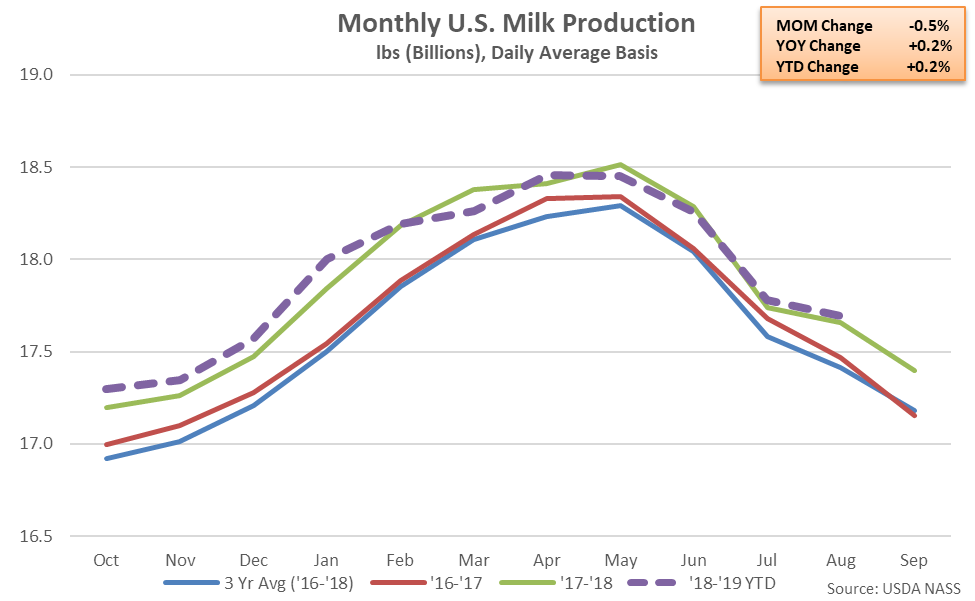 U.S. milk production volumes had finished higher on a YOY basis over 62 consecutive months from Jan ’14 – Feb ‘19, reaching the longest period of consecutive growth on record, prior to declining by a total of 0.1% over the past six months. 12-month rolling average production growth rates have declined over 23 of the past 24 months, reaching a nine year low during Aug ’19.
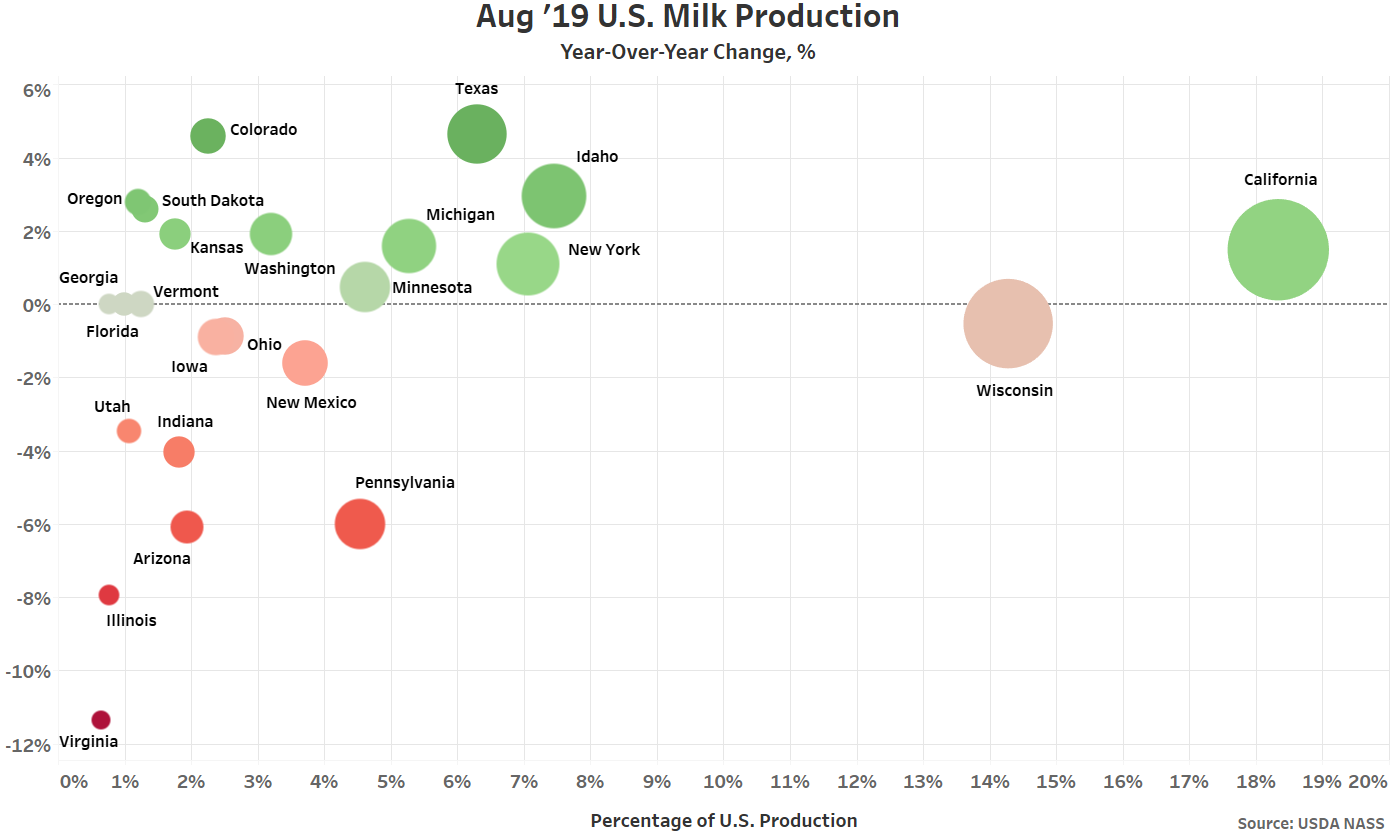
 YOY increases in production on a percentage basis were led by Texas (+4.6%) and Colorado (+4.6%), followed by Idaho (+2.9%). Production remained most significantly lower YOY on a percentage basis within Virginia (-11.4%), Illinois (-7.9%), Arizona (-6.1%) and Pennsylvania (-6.0%). Overall, 14 of the 24 states milk production figures are provided for experienced flat or increasing production on a YOY basis throughout the month.
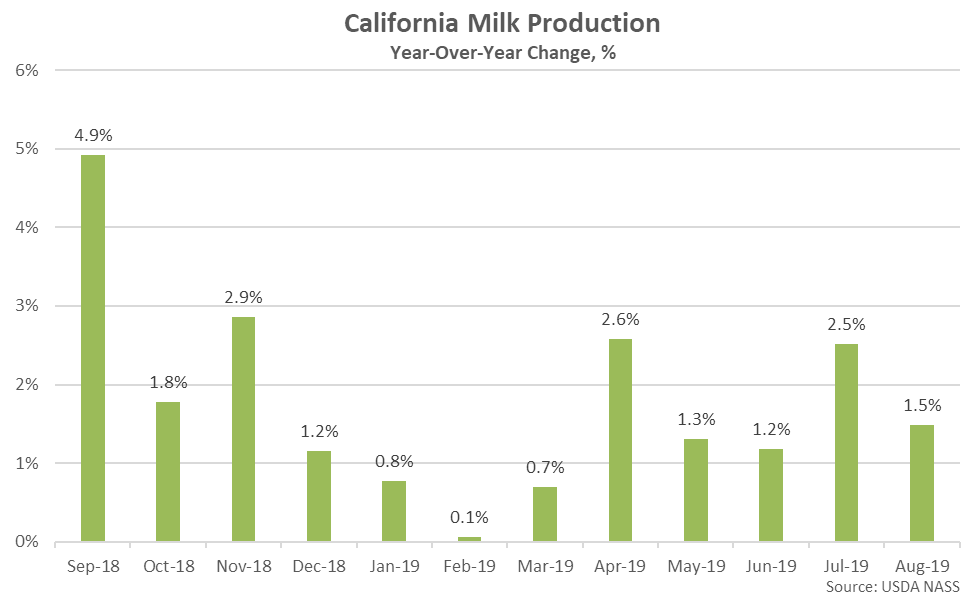
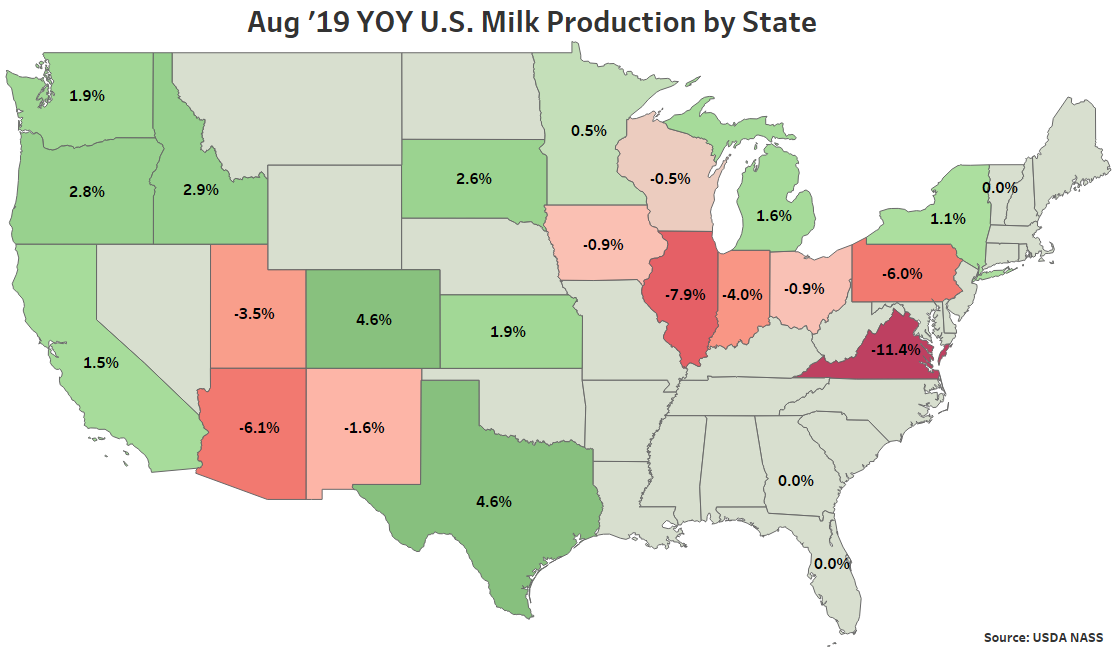 California milk production volumes increased on a YOY basis for the 13th consecutive month during Aug ’19, finishing up 1.5%. California accounted for 18% of total U.S. milk production volumes throughout the month, leading all states.
 Seven of the top ten largest milk producing states experienced YOY gains in production throughout Aug ’19, as milk production within the top ten milk producing states finished higher by a weighted average of 0.8% throughout the month. The aforementioned states accounted for just under three quarters of the total U.S. milk production experienced during Aug ’19. Production volumes outside of the top ten largest milk producing states declined by 1.5% YOY throughout the month, however.
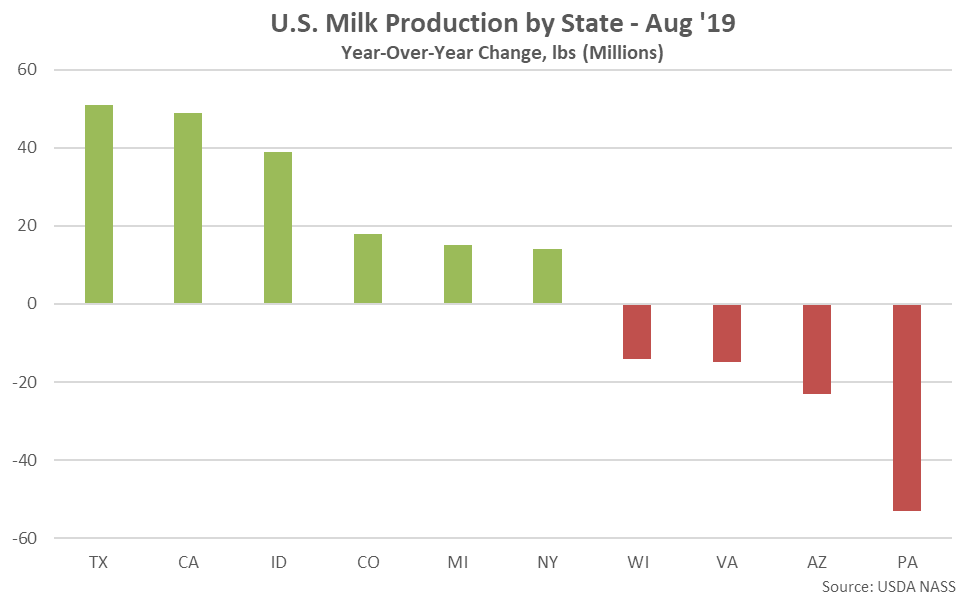
 YOY increases in milk production on an absolute basis were led by Texas, followed by California and Idaho, while YOY declines in production on an absolute basis were most significant throughout Pennsylvania, followed by Arizona and Virginia.
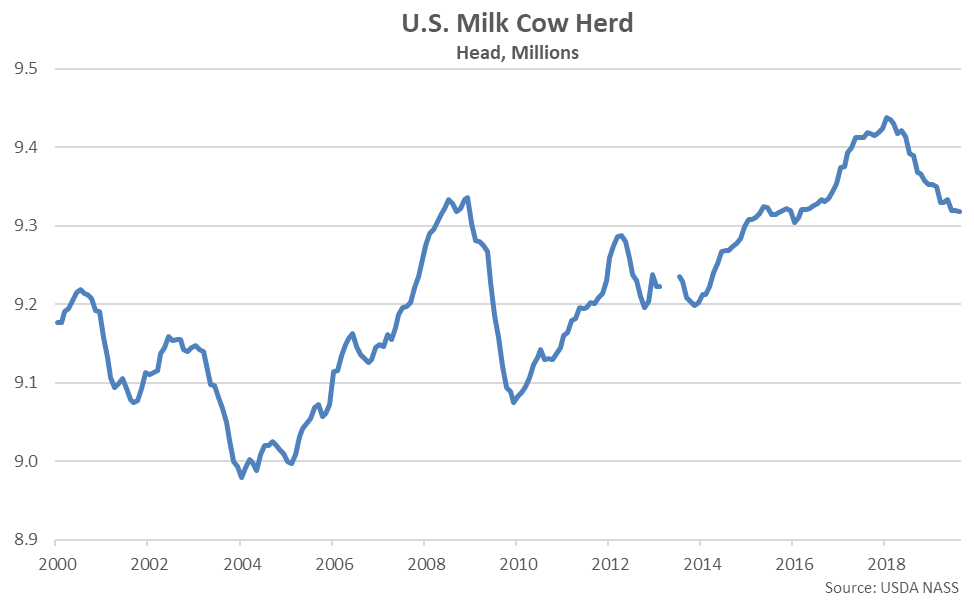
 Overall, the Aug ’19 U.S. milk cow herd declined 2,000 head from the previous month’s revised figure, reaching a three and a half year low level. The Jul ’19 milk cow herd figure was revised 10,000 head higher than previous stated, however, resulting in an 8,000 head net increase in herd figures relative to last month’s figure. The U.S. milk cow herd currently stands at 9.318 million head, which is 71,000 head below the previous year and 120,000 head below the 23 year high level experienced during Jan ’18.
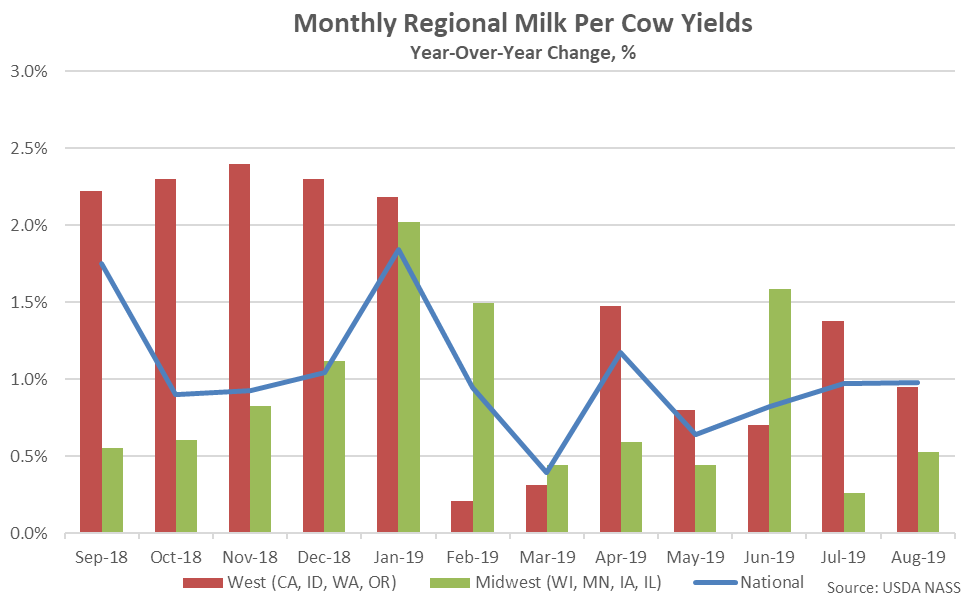
 The YOY decline in milk cow numbers was offset by continually increasing U.S. milk per cow yields experienced throughout Aug ’19. The U.S. milk per cow yield increased YOY for the 46th consecutive month throughout Aug ’19, finishing 1.0% above the previous year. Yields experienced throughout the Western states of California, Idaho, Washington and Oregon increased 0.9% YOY while yields experienced throughout the Midwestern states of Wisconsin, Minnesota, Iowa and Illinois finished 0.5% higher on a YOY basis.
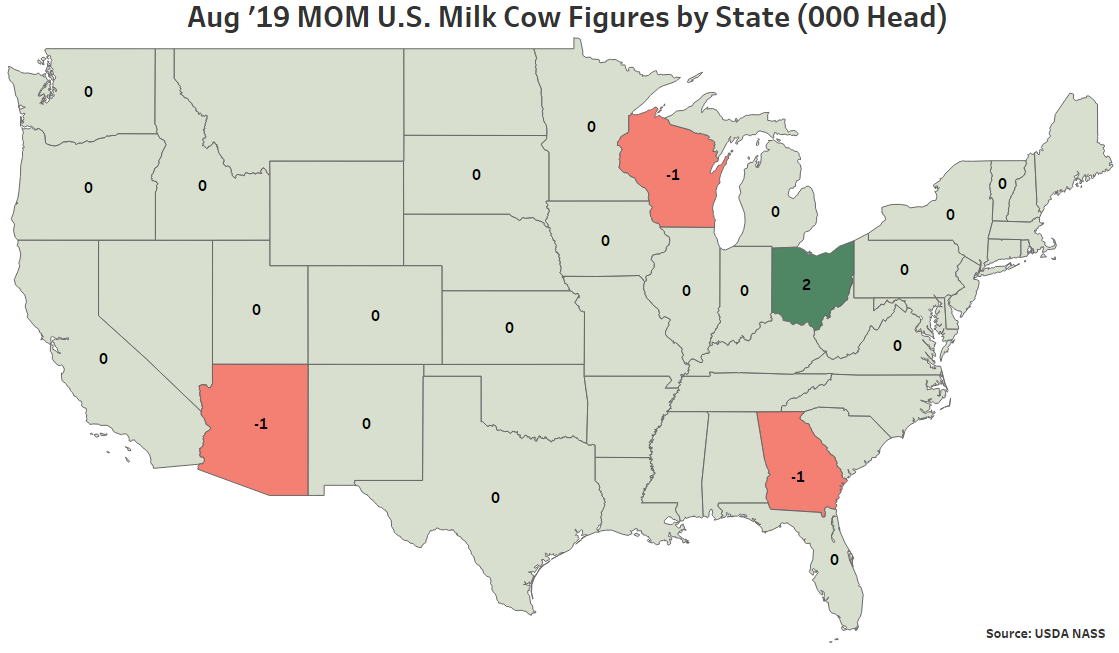
 Aug ’19 MOM declines in milk cow herds experienced throughout Wisconsin, Arizona and Georgia more than offset a MOM increase in the Ohio milk cow herd experienced throughout the month.
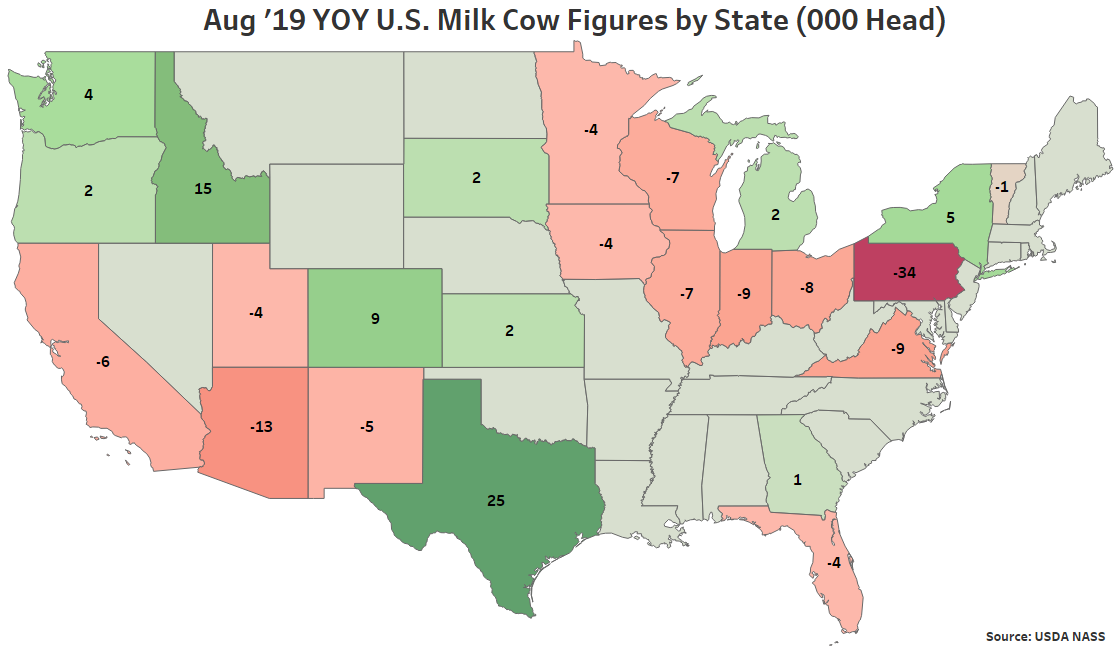
 Aug ’19 YOY declines in milk cow herds continue to be led by Pennsylvania, followed by Arizona, Indiana and Virginia. Texas, Idaho and Colorado experienced the largest YOY increases in their milk cow herds throughout the month.
- U.S. milk production increased 0.2% on a YOY basis throughout Aug ’19 however 12-month rolling average production growth rates declined to a nine year low.
- The Aug ’19 U.S. milk cow herd declined 2,000 head from the previous month’s revised figure, reaching a three and a half year low level. The Jul ’19 milk cow herd figure was revised 10,000 head higher than previous stated, however, resulting in an 8,000 head net increase in herd figures relative to last month’s figure. The U.S. milk cow herd currently stands at 9.318 million head, which is 71,000 head below the previous year and 120,000 head below the 23 year high level experienced during Jan ’18.
- U.S. milk per cow yields increased YOY for the 46th consecutive month throughout Aug ’19, finishing 1.0% above the previous year.
U.S. milk production volumes had finished higher on a YOY basis over 62 consecutive months from Jan ’14 – Feb ‘19, reaching the longest period of consecutive growth on record, prior to declining by a total of 0.1% over the past six months. 12-month rolling average production growth rates have declined over 23 of the past 24 months, reaching a nine year low during Aug ’19.
YOY increases in production on a percentage basis were led by Texas (+4.6%) and Colorado (+4.6%), followed by Idaho (+2.9%). Production remained most significantly lower YOY on a percentage basis within Virginia (-11.4%), Illinois (-7.9%), Arizona (-6.1%) and Pennsylvania (-6.0%). Overall, 14 of the 24 states milk production figures are provided for experienced flat or increasing production on a YOY basis throughout the month.
California milk production volumes increased on a YOY basis for the 13th consecutive month during Aug ’19, finishing up 1.5%. California accounted for 18% of total U.S. milk production volumes throughout the month, leading all states.
Seven of the top ten largest milk producing states experienced YOY gains in production throughout Aug ’19, as milk production within the top ten milk producing states finished higher by a weighted average of 0.8% throughout the month. The aforementioned states accounted for just under three quarters of the total U.S. milk production experienced during Aug ’19. Production volumes outside of the top ten largest milk producing states declined by 1.5% YOY throughout the month, however.
YOY increases in milk production on an absolute basis were led by Texas, followed by California and Idaho, while YOY declines in production on an absolute basis were most significant throughout Pennsylvania, followed by Arizona and Virginia.
Overall, the Aug ’19 U.S. milk cow herd declined 2,000 head from the previous month’s revised figure, reaching a three and a half year low level. The Jul ’19 milk cow herd figure was revised 10,000 head higher than previous stated, however, resulting in an 8,000 head net increase in herd figures relative to last month’s figure. The U.S. milk cow herd currently stands at 9.318 million head, which is 71,000 head below the previous year and 120,000 head below the 23 year high level experienced during Jan ’18.
The YOY decline in milk cow numbers was offset by continually increasing U.S. milk per cow yields experienced throughout Aug ’19. The U.S. milk per cow yield increased YOY for the 46th consecutive month throughout Aug ’19, finishing 1.0% above the previous year. Yields experienced throughout the Western states of California, Idaho, Washington and Oregon increased 0.9% YOY while yields experienced throughout the Midwestern states of Wisconsin, Minnesota, Iowa and Illinois finished 0.5% higher on a YOY basis.
Aug ’19 MOM declines in milk cow herds experienced throughout Wisconsin, Arizona and Georgia more than offset a MOM increase in the Ohio milk cow herd experienced throughout the month.
Aug ’19 YOY declines in milk cow herds continue to be led by Pennsylvania, followed by Arizona, Indiana and Virginia. Texas, Idaho and Colorado experienced the largest YOY increases in their milk cow herds throughout the month.