U.S. Dairy Cold Storage Update – Oct ’19
Executive Summary
U.S. cold storage figures provided by USDA were recently updated with values spanning through Sep ’19. Highlights from the updated report include:
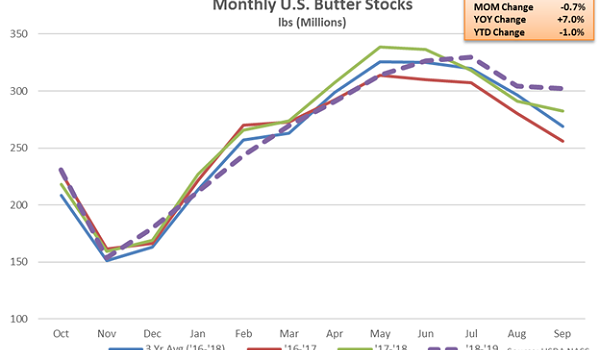
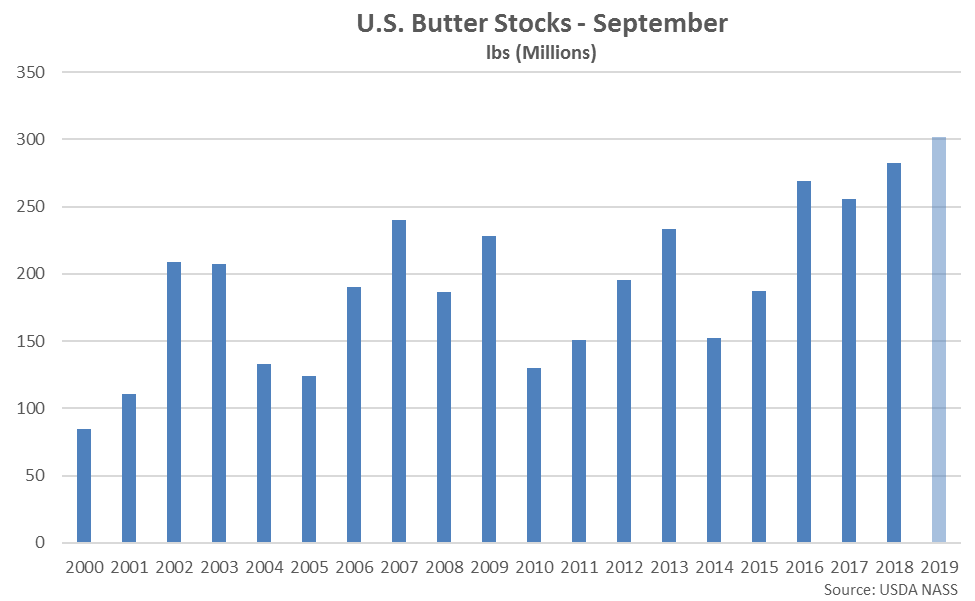
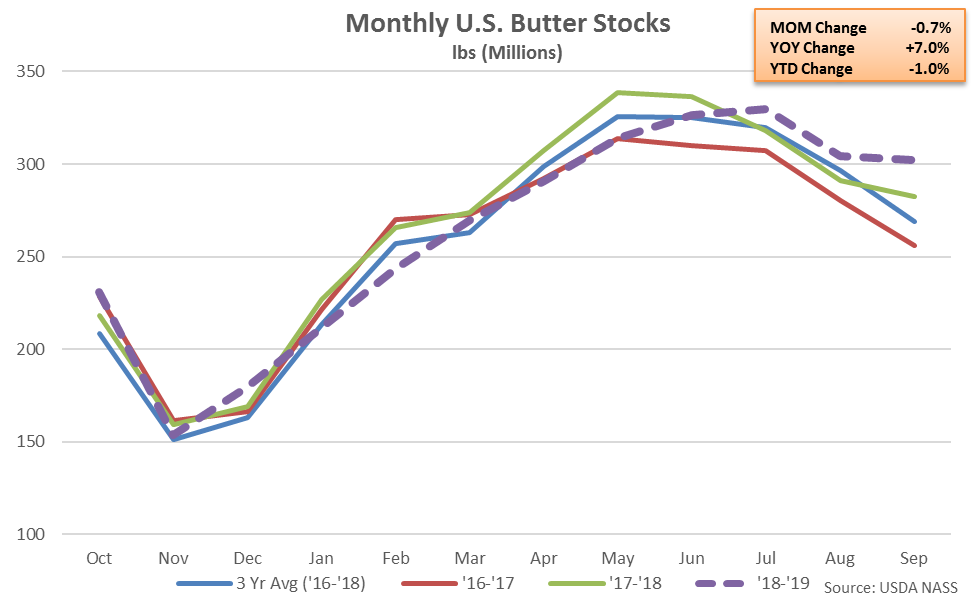 According to USDA, Sep ’19 U.S. butter stocks declined seasonally but remained higher on a YOY basis for the third consecutive month, finishing up 7.0% to a 26 year seasonal high level. The MOM decline in butter stocks of 2.2 million pounds, or 0.7%, was significantly below the ten year average August – September seasonal decline of 23.5 million pounds, or 10.2%. Butter stocks typically decline seasonally throughout the second half of the calendar year, reaching seasonal lows throughout the months of November and December.
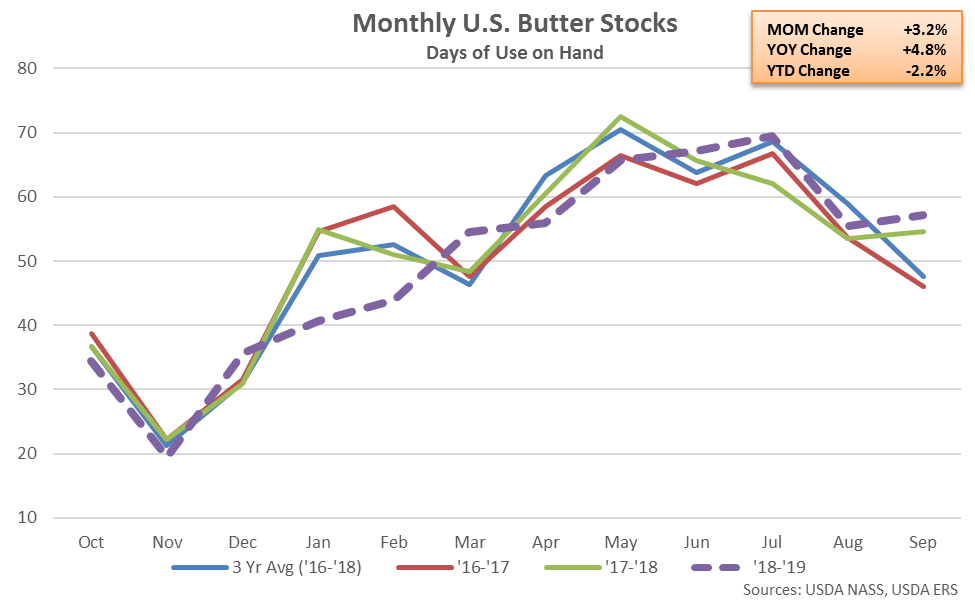
 On a days of usage basis, Sep ’19 U.S. butter stocks also finished higher YOY. When assuming 12-month rolling average YOY changes in usage rates and known stock values for the month of September, butter stocks on a days of usage basis increased YOY for the fourth consecutive month, finishing up 4.8%.
 Cheese – Stocks Increase Contraseasonally but Remain Slightly Lower YOY, Down 0.8%
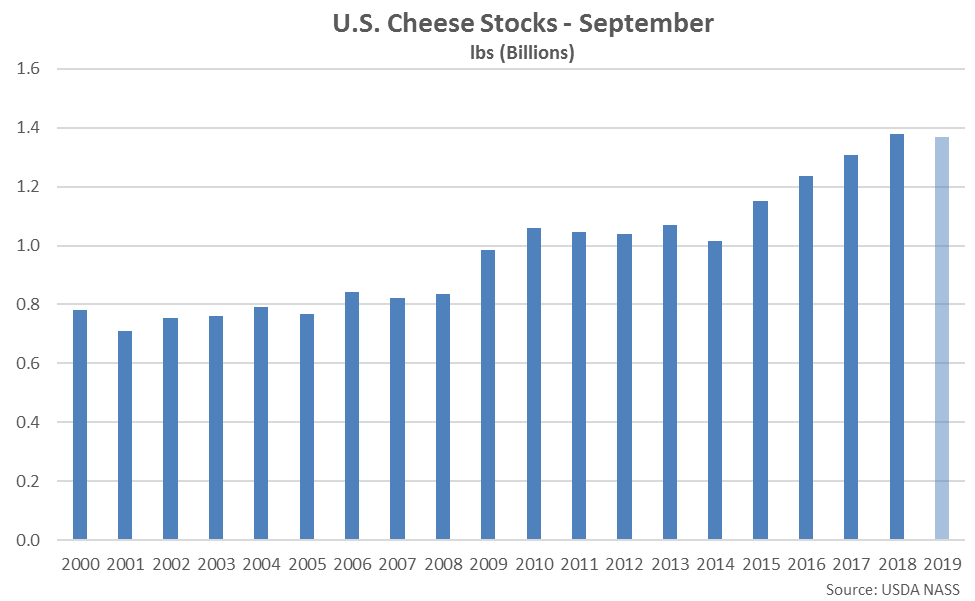
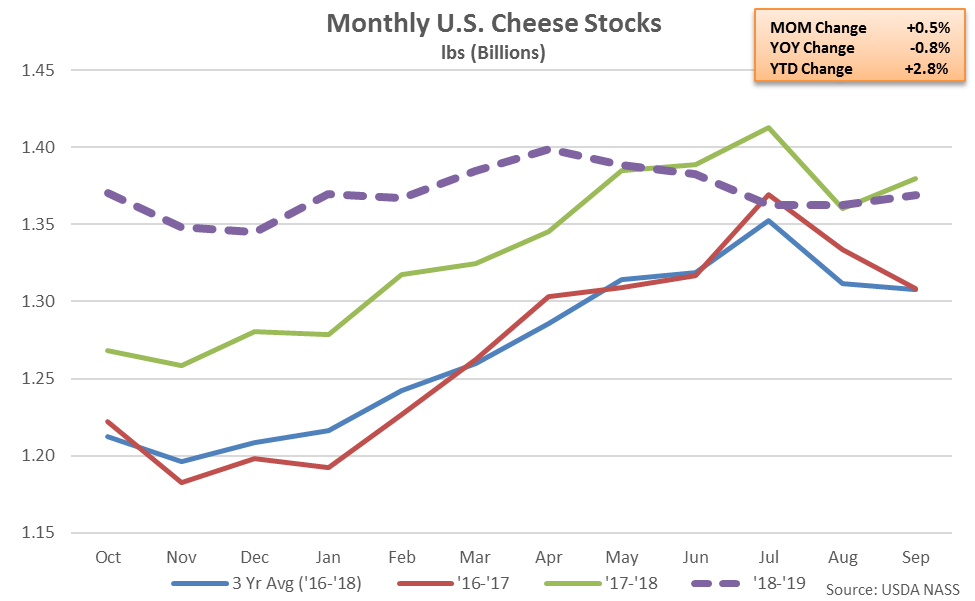 Sep ’19 U.S. cheese stocks increased contraseasonally but remained lower on a YOY basis for the third time in the past four months, finishing 0.8% below the record high seasonal levels experienced during the previous year. American cheese stocks declined 4.0% YOY throughout the month, more than offsetting a 3.8% YOY increase in other-than-American cheese stocks. The MOM seasonal increase in cheese stocks of 6.4 million pounds, or 0.5%, was a contraseasonal move when compared to the ten year average August – September seasonal decline of 12.5 million pounds, or 1.2%.
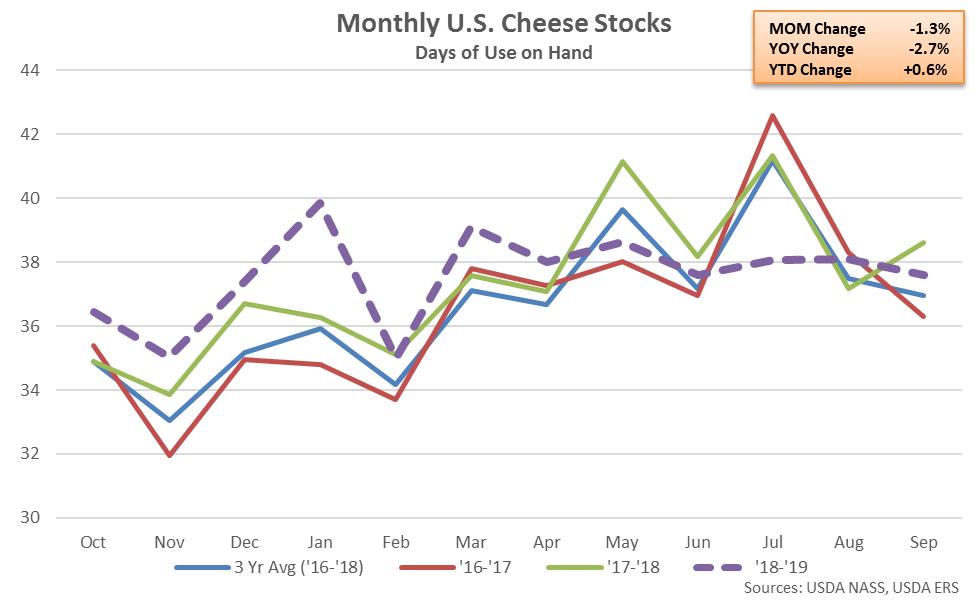
 On a days of usage basis, Sep ’19 U.S. cheese stocks also finished lower YOY. When assuming 12-month rolling average YOY changes in usage rates and known stock values for the month of September, cheese stocks on a days of usage basis declined YOY for the fourth time in the past five months, finishing down 2.7%.
 Combined Dairy Product Stocks – Aug Stocks up 0.2% YOY, Sep Stocks Projected Down 0.1% YOY
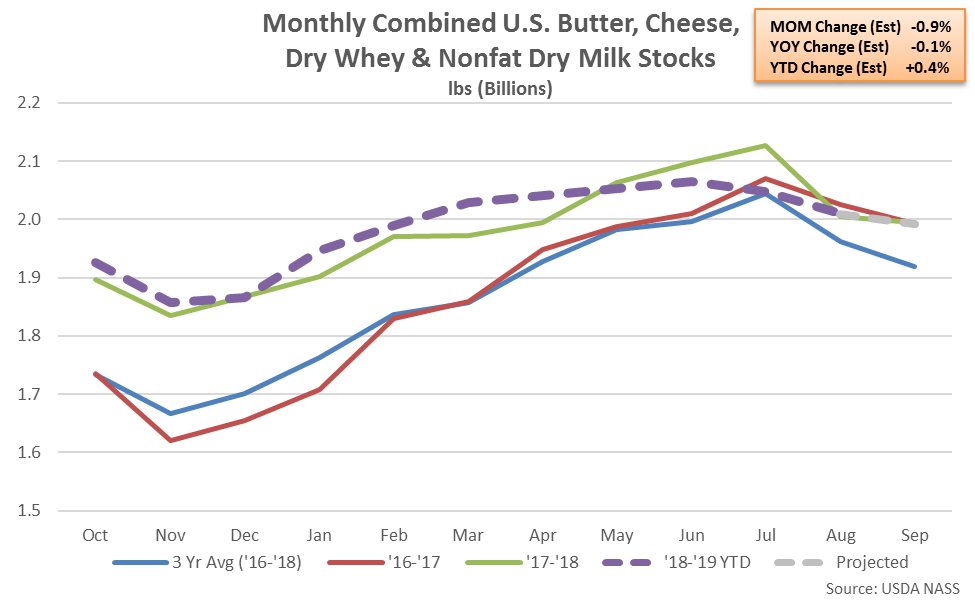 Aug ’19 combined stocks of butter, cheese, dry whey and NFDM increased on a YOY basis for the first time in the past four months, finishing up 0.2%. Combined dairy product stocks remained 0.8% below the record high seasonal level experienced during August of 2017, however.
Combined stocks of butter, cheese, dry whey and NFDM are expected to finish lower on a YOY basis for the fourth time in the past five months throughout Sep ’19 when using actual butter and cheese stock figures and previous month YOY changes in dry whey and NFDM stocks, however, declining by an estimated 0.1%. Sep ’19 dry whey and NFDM stock figures will be available November 5th.
Aug ’19 combined stocks of butter, cheese, dry whey and NFDM increased on a YOY basis for the first time in the past four months, finishing up 0.2%. Combined dairy product stocks remained 0.8% below the record high seasonal level experienced during August of 2017, however.
Combined stocks of butter, cheese, dry whey and NFDM are expected to finish lower on a YOY basis for the fourth time in the past five months throughout Sep ’19 when using actual butter and cheese stock figures and previous month YOY changes in dry whey and NFDM stocks, however, declining by an estimated 0.1%. Sep ’19 dry whey and NFDM stock figures will be available November 5th.
- Sep ’19 U.S. butter stocks remained higher on a YOY basis for the third consecutive month, finishing up 7.0% and reaching a 26 year seasonal high level.
- Sep ’19 U.S. cheese stocks increased contraseasonally from the previous month but remained 0.8% below the record high seasonal levels experienced throughout the previous year.
According to USDA, Sep ’19 U.S. butter stocks declined seasonally but remained higher on a YOY basis for the third consecutive month, finishing up 7.0% to a 26 year seasonal high level. The MOM decline in butter stocks of 2.2 million pounds, or 0.7%, was significantly below the ten year average August – September seasonal decline of 23.5 million pounds, or 10.2%. Butter stocks typically decline seasonally throughout the second half of the calendar year, reaching seasonal lows throughout the months of November and December.
On a days of usage basis, Sep ’19 U.S. butter stocks also finished higher YOY. When assuming 12-month rolling average YOY changes in usage rates and known stock values for the month of September, butter stocks on a days of usage basis increased YOY for the fourth consecutive month, finishing up 4.8%.
Cheese – Stocks Increase Contraseasonally but Remain Slightly Lower YOY, Down 0.8%
Sep ’19 U.S. cheese stocks increased contraseasonally but remained lower on a YOY basis for the third time in the past four months, finishing 0.8% below the record high seasonal levels experienced during the previous year. American cheese stocks declined 4.0% YOY throughout the month, more than offsetting a 3.8% YOY increase in other-than-American cheese stocks. The MOM seasonal increase in cheese stocks of 6.4 million pounds, or 0.5%, was a contraseasonal move when compared to the ten year average August – September seasonal decline of 12.5 million pounds, or 1.2%.
On a days of usage basis, Sep ’19 U.S. cheese stocks also finished lower YOY. When assuming 12-month rolling average YOY changes in usage rates and known stock values for the month of September, cheese stocks on a days of usage basis declined YOY for the fourth time in the past five months, finishing down 2.7%.
Combined Dairy Product Stocks – Aug Stocks up 0.2% YOY, Sep Stocks Projected Down 0.1% YOY
Aug ’19 combined stocks of butter, cheese, dry whey and NFDM increased on a YOY basis for the first time in the past four months, finishing up 0.2%. Combined dairy product stocks remained 0.8% below the record high seasonal level experienced during August of 2017, however.
Combined stocks of butter, cheese, dry whey and NFDM are expected to finish lower on a YOY basis for the fourth time in the past five months throughout Sep ’19 when using actual butter and cheese stock figures and previous month YOY changes in dry whey and NFDM stocks, however, declining by an estimated 0.1%. Sep ’19 dry whey and NFDM stock figures will be available November 5th.