U.S. Livestock & Meat Trade Update – Mar ’20
Executive Summary
U.S. livestock and meat trade figures provided by the USDA were recently updated with values spanning through Jan ’20. Highlights from the updated report include:
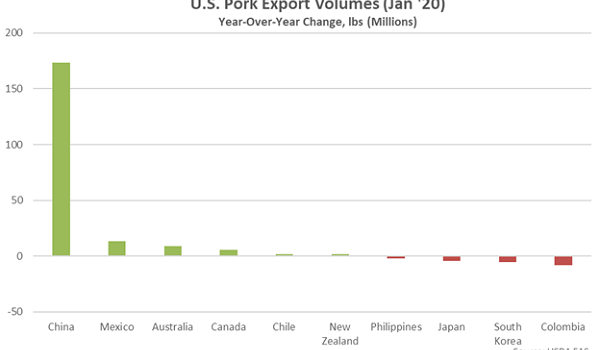
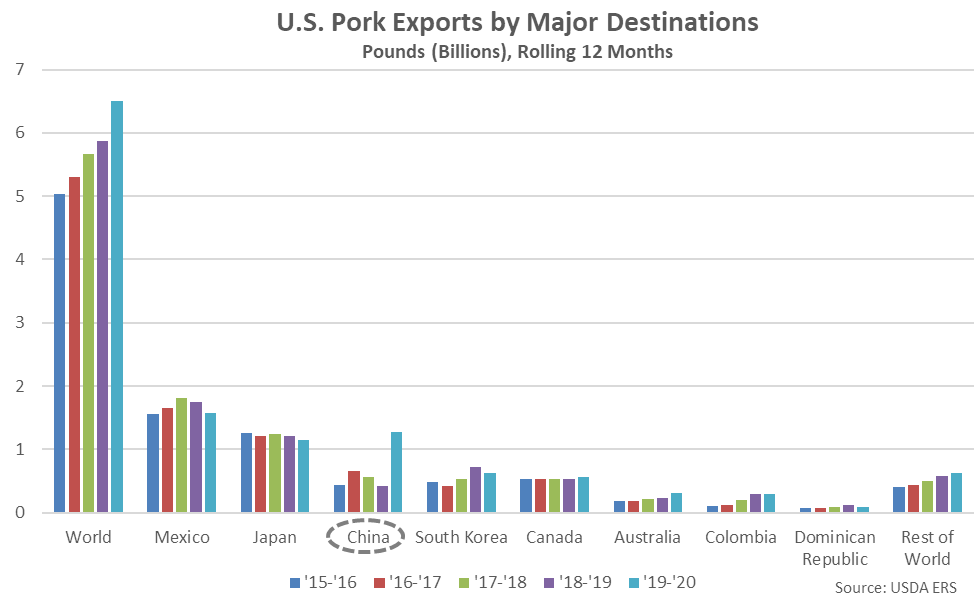
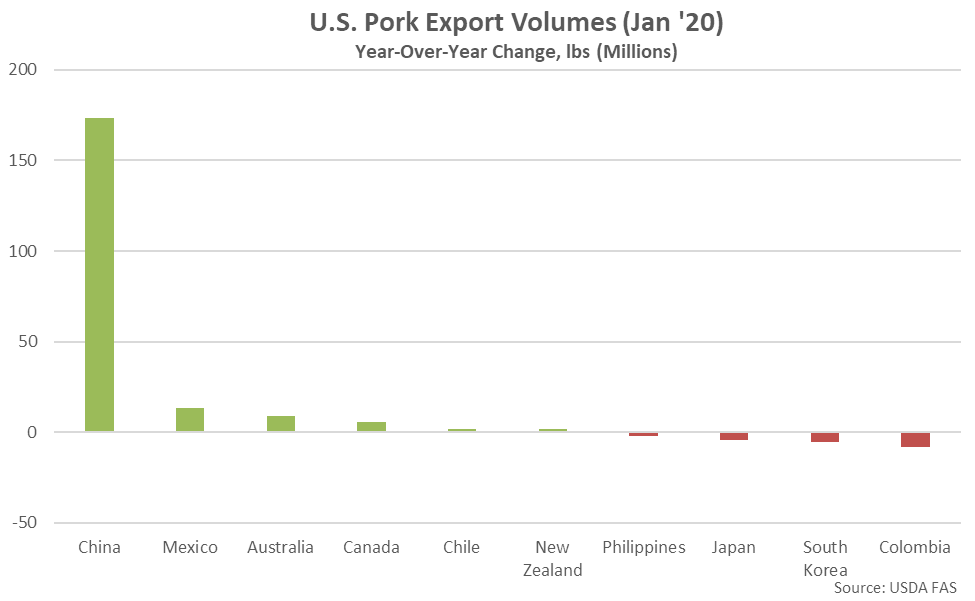 Mexico and Japan have historically been the largest importers of U.S. pork products, accounting for over half of the total U.S. pork export volumes throughout the past five years. Combined U.S. pork export volumes destined to Mexico and Japan have declined on a YOY basis by 8.1% throughout the past 12 months, however. Throughout the past 12 months, YOY increases in U.S. pork exports have been led by product destined to China, Hong Kong & Taiwan, followed by Australia, while shipments destined to Mexico, South Korea and Japan have declined most significantly on a YOY basis over the period.
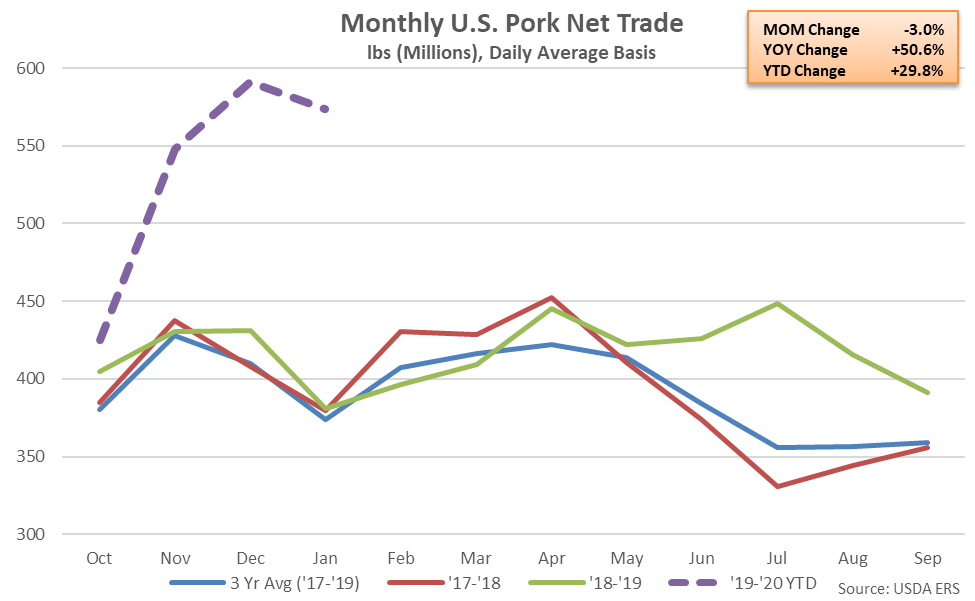
 U.S. pork import volumes remained lower on a YOY basis for the 21st consecutive month during Jan ’20, finishing down 16.4%. The decline in pork import volumes, coupled with the increase in pork export volumes, resulted in U.S. net pork trade finishing up 50.6% YOY during Jan ’20, reaching a record high seasonal level. The YOY increase in net pork trade was the ninth experienced in a row and the largest experienced throughout the past eight years on a percentage basis.
’18-’19 annual net pork trade increased 5.6% YOY, finishing at a record high level for the second consecutive year. ’19-’20 YTD net pork trade has increased an additional 29.8% on a YOY basis throughout the first third of the production season.
U.S. pork import volumes remained lower on a YOY basis for the 21st consecutive month during Jan ’20, finishing down 16.4%. The decline in pork import volumes, coupled with the increase in pork export volumes, resulted in U.S. net pork trade finishing up 50.6% YOY during Jan ’20, reaching a record high seasonal level. The YOY increase in net pork trade was the ninth experienced in a row and the largest experienced throughout the past eight years on a percentage basis.
’18-’19 annual net pork trade increased 5.6% YOY, finishing at a record high level for the second consecutive year. ’19-’20 YTD net pork trade has increased an additional 29.8% on a YOY basis throughout the first third of the production season.
 Beef & Veal – Exports Increase YOY for the First Time in 13 Months, Net Trade Remains Positive
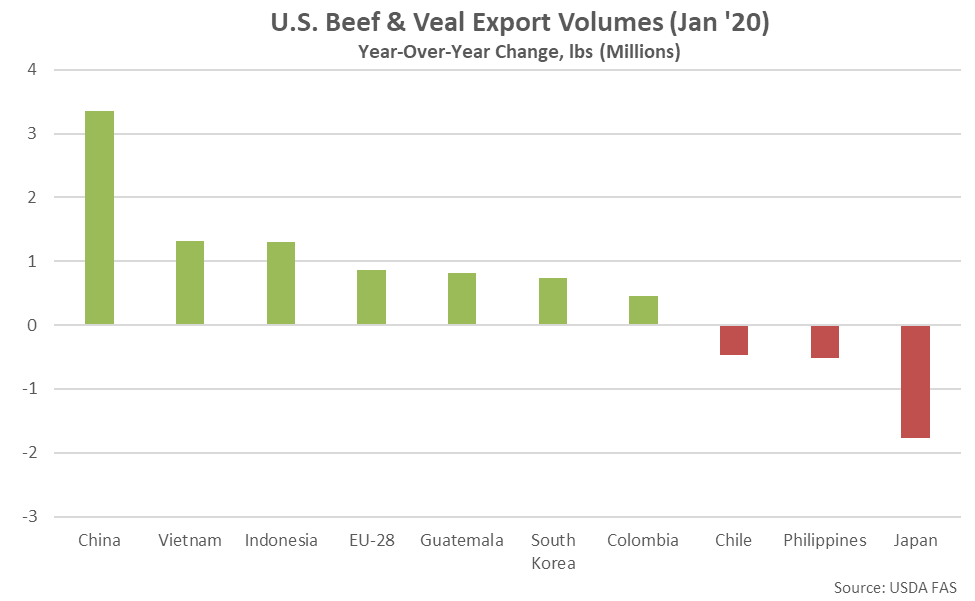
U.S. beef & veal export volumes increased on a YOY basis for the first time in the past 13 months during Jan ’20, finishing up 3.1% and reaching a record high seasonal level. YOY increases in U.S. beef & veal export volumes were led by shipments destined to China, Hong Kong & Taiwan, followed by shipments destined to Vietnam and Indonesia, while export volumes destined to Japan finished most significantly lower on a YOY basis throughout the month.
Beef & Veal – Exports Increase YOY for the First Time in 13 Months, Net Trade Remains Positive
U.S. beef & veal export volumes increased on a YOY basis for the first time in the past 13 months during Jan ’20, finishing up 3.1% and reaching a record high seasonal level. YOY increases in U.S. beef & veal export volumes were led by shipments destined to China, Hong Kong & Taiwan, followed by shipments destined to Vietnam and Indonesia, while export volumes destined to Japan finished most significantly lower on a YOY basis throughout the month.
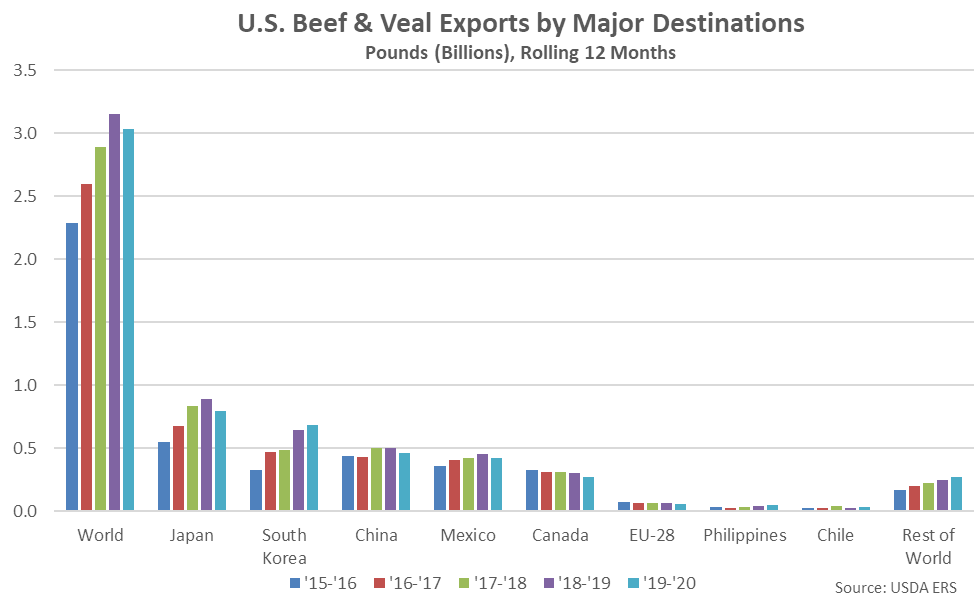
 Japan, South Korea, China, Hong Kong & Taiwan, Mexico and Canada have historically been the largest importers of U.S. beef & veal products, combining to account for nearly 90% of the total U.S. beef & veal export volumes throughout the past five years. Throughout the past 12 months, U.S. beef & veal export volumes destined to South Korea have increased most significantly on a YOY basis, while shipments destined to Japan have declined most significantly on a YOY basis over the period.
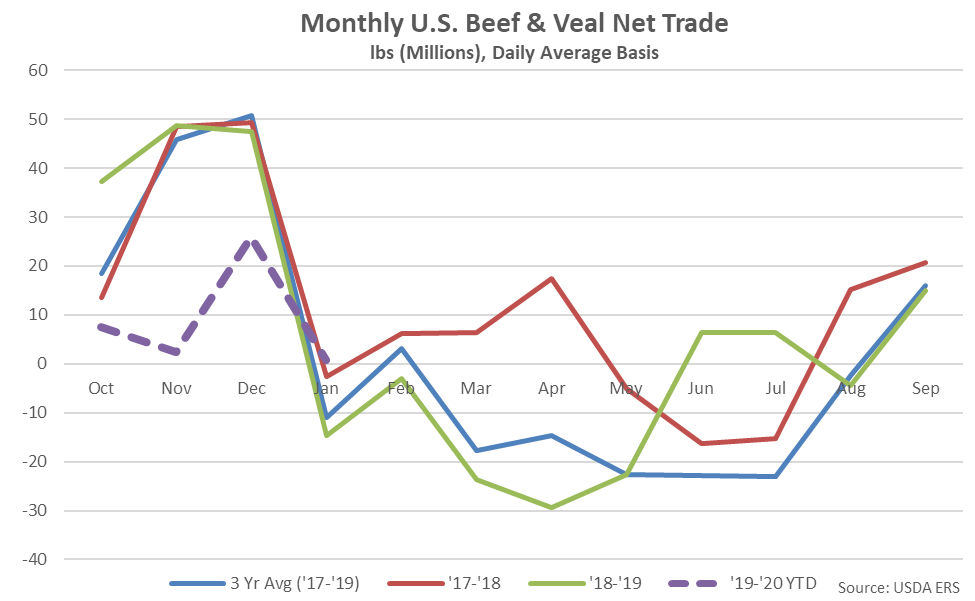
 U.S. beef & veal import volumes declined on a YOY basis for the first time in the past four months during Jan ’20, finishing down 3.5%. Beef & veal export volumes continued to exceed import volumes for the fifth consecutive month during Jan ’20, resulting in U.S. beef & veal trade remaining at a positive level. Jan ’20 beef & veal net trade finished at a six year seasonal high level.
’18-’19 annual beef & veal net trade finished at a positive level for the second consecutive year however beef & veal net trade remained 54.2% below previous year levels. ’19-’20 YTD net beef & veal trade has declined an additional 69.1% on a YOY basis throughout the first third of the production season.
U.S. beef & veal import volumes declined on a YOY basis for the first time in the past four months during Jan ’20, finishing down 3.5%. Beef & veal export volumes continued to exceed import volumes for the fifth consecutive month during Jan ’20, resulting in U.S. beef & veal trade remaining at a positive level. Jan ’20 beef & veal net trade finished at a six year seasonal high level.
’18-’19 annual beef & veal net trade finished at a positive level for the second consecutive year however beef & veal net trade remained 54.2% below previous year levels. ’19-’20 YTD net beef & veal trade has declined an additional 69.1% on a YOY basis throughout the first third of the production season.
 Broilers – Net Trade Reaches a Six Year Seasonal High Level, Finishes up 2.5% YOY
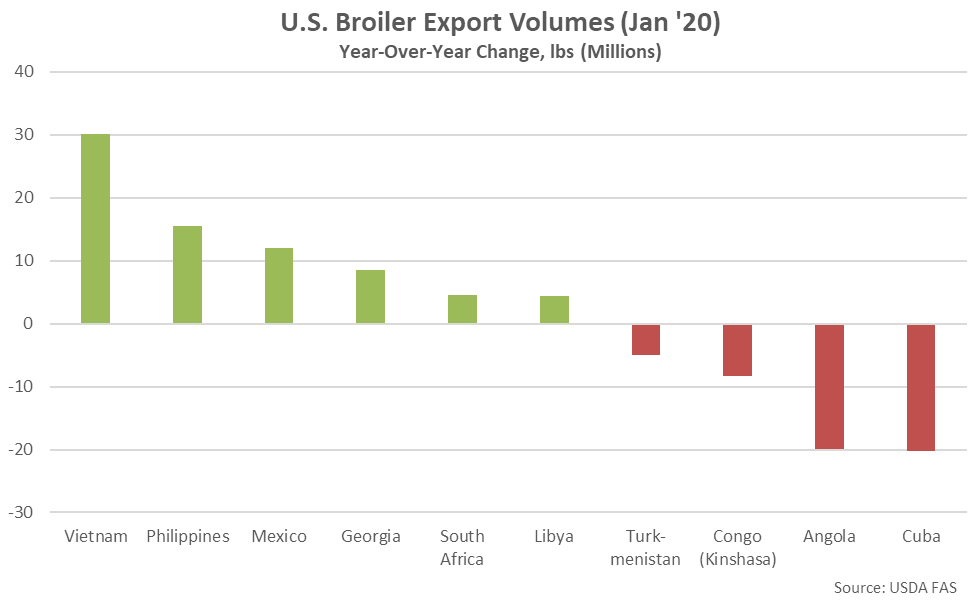
U.S. broiler export volumes increased on a YOY basis for the third consecutive month during Jan ’20, finishing up 2.7% and reaching a six year high seasonal level. YOY increases in U.S. broiler export volumes were led by shipments destined to Vietnam, followed by shipments destined to the Philippines and Mexico, while export volumes destined to Cuba and Angola declined most significantly on a YOY basis throughout the month.
Broilers – Net Trade Reaches a Six Year Seasonal High Level, Finishes up 2.5% YOY
U.S. broiler export volumes increased on a YOY basis for the third consecutive month during Jan ’20, finishing up 2.7% and reaching a six year high seasonal level. YOY increases in U.S. broiler export volumes were led by shipments destined to Vietnam, followed by shipments destined to the Philippines and Mexico, while export volumes destined to Cuba and Angola declined most significantly on a YOY basis throughout the month.
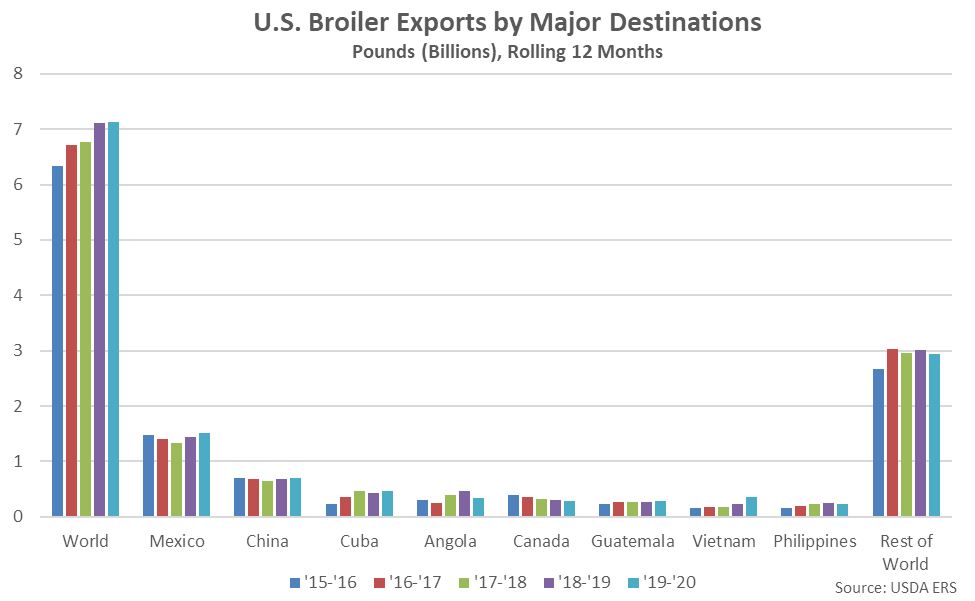
 Mexico has historically been the largest importer of U.S. broilers, accounting for over one fifth of the total U.S. broiler export volumes throughout the past five years. Throughout the past 12 months, U.S. broiler export volumes destined to Georgia have increased most significantly on a YOY basis, followed by volumes destined to Vietnam, while shipments destined to Angola have declined most significantly on a YOY basis over the period.
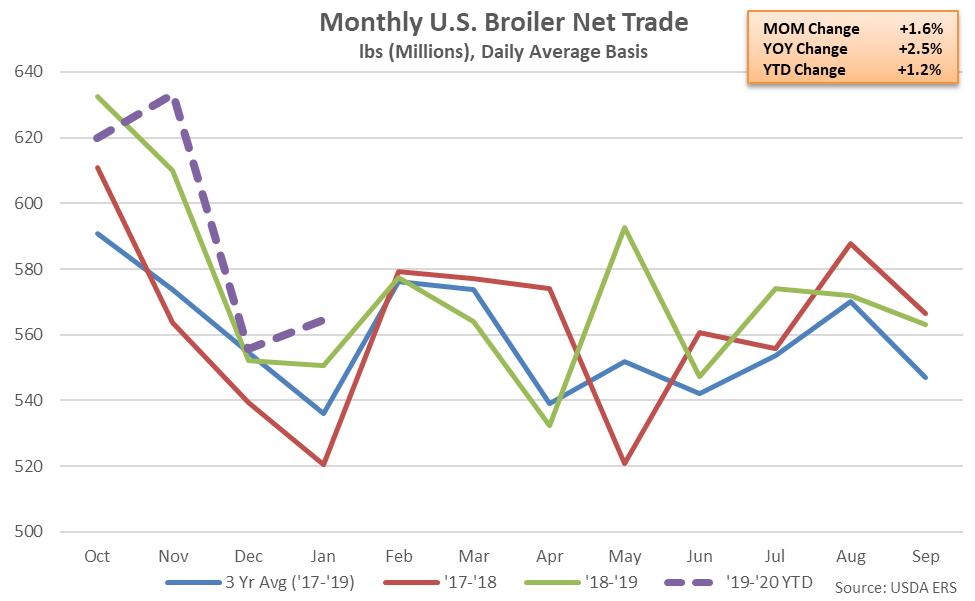
 U.S. broiler import volumes increased on a YOY basis for the second consecutive month during Jan ’20, finishing up 13.3% and reaching a three year seasonal high level. Broiler import volumes remained at insignificant levels relative to export volumes, however, as Jan ’20 imports amounted to just 2.2% of export volumes. The YOY increase in broiler export volumes more than offset the YOY increase in import volumes, resulted in U.S. broiler net trade finishing 2.5% higher on a YOY basis during Jan ’20, reaching a six year high seasonal level.
’18-’19 annual net broiler trade finished up 1.7% YOY, reaching a five year high, despite the declines experienced throughout the final months of the production season. ’19-’20 YTD net broiler trade has increased an additional 1.2% on a YOY basis throughout the first third of the production season.
U.S. broiler import volumes increased on a YOY basis for the second consecutive month during Jan ’20, finishing up 13.3% and reaching a three year seasonal high level. Broiler import volumes remained at insignificant levels relative to export volumes, however, as Jan ’20 imports amounted to just 2.2% of export volumes. The YOY increase in broiler export volumes more than offset the YOY increase in import volumes, resulted in U.S. broiler net trade finishing 2.5% higher on a YOY basis during Jan ’20, reaching a six year high seasonal level.
’18-’19 annual net broiler trade finished up 1.7% YOY, reaching a five year high, despite the declines experienced throughout the final months of the production season. ’19-’20 YTD net broiler trade has increased an additional 1.2% on a YOY basis throughout the first third of the production season.
 Combined Net Trade
Overall, combined net trade of U.S. pork, beef and broilers increased on a YOY basis for the eighth time in the past nine months during Jan ’20, finishing up 222.0 million pounds, or 24.2%. The YOY increase in combined net trade of U.S. pork, beef and broilers was the largest experienced throughout the past three years.
Combined Net Trade
Overall, combined net trade of U.S. pork, beef and broilers increased on a YOY basis for the eighth time in the past nine months during Jan ’20, finishing up 222.0 million pounds, or 24.2%. The YOY increase in combined net trade of U.S. pork, beef and broilers was the largest experienced throughout the past three years.
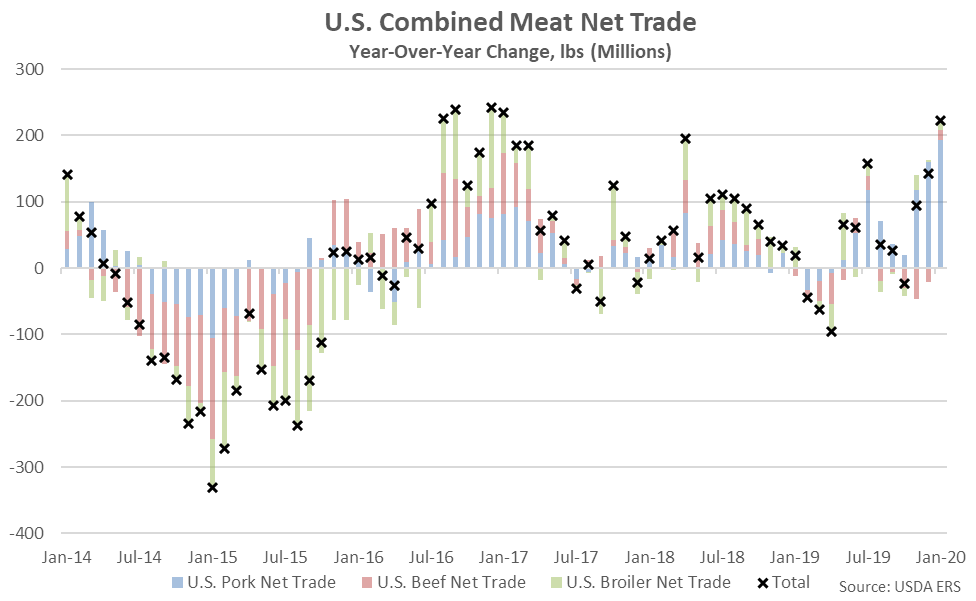
- U.S. net pork trade increased on a YOY basis for the ninth consecutive month during Jan ’20, finishing up 50.6% to a record high seasonal level. Pork export volumes increased 38.8% on a YOY basis throughout the month, driven higher by continued growth in volumes destined to China, Hong Kong & Taiwan.
- U.S. beef & veal export volumes increased on a YOY basis for the first time in the past 13 months during Jan ’20, finishing up 3.1% and reaching a record high seasonal level. Net beef & veal trade remained at a positive level for the fifth consecutive month, finishing at a six year seasonal high level.
- U.S. net broiler trade reached a six year seasonal high level during Jan ’20, finishing 2.5% higher on a YOY basis.
Mexico and Japan have historically been the largest importers of U.S. pork products, accounting for over half of the total U.S. pork export volumes throughout the past five years. Combined U.S. pork export volumes destined to Mexico and Japan have declined on a YOY basis by 8.1% throughout the past 12 months, however. Throughout the past 12 months, YOY increases in U.S. pork exports have been led by product destined to China, Hong Kong & Taiwan, followed by Australia, while shipments destined to Mexico, South Korea and Japan have declined most significantly on a YOY basis over the period.
U.S. pork import volumes remained lower on a YOY basis for the 21st consecutive month during Jan ’20, finishing down 16.4%. The decline in pork import volumes, coupled with the increase in pork export volumes, resulted in U.S. net pork trade finishing up 50.6% YOY during Jan ’20, reaching a record high seasonal level. The YOY increase in net pork trade was the ninth experienced in a row and the largest experienced throughout the past eight years on a percentage basis.
’18-’19 annual net pork trade increased 5.6% YOY, finishing at a record high level for the second consecutive year. ’19-’20 YTD net pork trade has increased an additional 29.8% on a YOY basis throughout the first third of the production season.
Beef & Veal – Exports Increase YOY for the First Time in 13 Months, Net Trade Remains Positive
U.S. beef & veal export volumes increased on a YOY basis for the first time in the past 13 months during Jan ’20, finishing up 3.1% and reaching a record high seasonal level. YOY increases in U.S. beef & veal export volumes were led by shipments destined to China, Hong Kong & Taiwan, followed by shipments destined to Vietnam and Indonesia, while export volumes destined to Japan finished most significantly lower on a YOY basis throughout the month.
Japan, South Korea, China, Hong Kong & Taiwan, Mexico and Canada have historically been the largest importers of U.S. beef & veal products, combining to account for nearly 90% of the total U.S. beef & veal export volumes throughout the past five years. Throughout the past 12 months, U.S. beef & veal export volumes destined to South Korea have increased most significantly on a YOY basis, while shipments destined to Japan have declined most significantly on a YOY basis over the period.
U.S. beef & veal import volumes declined on a YOY basis for the first time in the past four months during Jan ’20, finishing down 3.5%. Beef & veal export volumes continued to exceed import volumes for the fifth consecutive month during Jan ’20, resulting in U.S. beef & veal trade remaining at a positive level. Jan ’20 beef & veal net trade finished at a six year seasonal high level.
’18-’19 annual beef & veal net trade finished at a positive level for the second consecutive year however beef & veal net trade remained 54.2% below previous year levels. ’19-’20 YTD net beef & veal trade has declined an additional 69.1% on a YOY basis throughout the first third of the production season.
Broilers – Net Trade Reaches a Six Year Seasonal High Level, Finishes up 2.5% YOY
U.S. broiler export volumes increased on a YOY basis for the third consecutive month during Jan ’20, finishing up 2.7% and reaching a six year high seasonal level. YOY increases in U.S. broiler export volumes were led by shipments destined to Vietnam, followed by shipments destined to the Philippines and Mexico, while export volumes destined to Cuba and Angola declined most significantly on a YOY basis throughout the month.
Mexico has historically been the largest importer of U.S. broilers, accounting for over one fifth of the total U.S. broiler export volumes throughout the past five years. Throughout the past 12 months, U.S. broiler export volumes destined to Georgia have increased most significantly on a YOY basis, followed by volumes destined to Vietnam, while shipments destined to Angola have declined most significantly on a YOY basis over the period.
U.S. broiler import volumes increased on a YOY basis for the second consecutive month during Jan ’20, finishing up 13.3% and reaching a three year seasonal high level. Broiler import volumes remained at insignificant levels relative to export volumes, however, as Jan ’20 imports amounted to just 2.2% of export volumes. The YOY increase in broiler export volumes more than offset the YOY increase in import volumes, resulted in U.S. broiler net trade finishing 2.5% higher on a YOY basis during Jan ’20, reaching a six year high seasonal level.
’18-’19 annual net broiler trade finished up 1.7% YOY, reaching a five year high, despite the declines experienced throughout the final months of the production season. ’19-’20 YTD net broiler trade has increased an additional 1.2% on a YOY basis throughout the first third of the production season.
Combined Net Trade
Overall, combined net trade of U.S. pork, beef and broilers increased on a YOY basis for the eighth time in the past nine months during Jan ’20, finishing up 222.0 million pounds, or 24.2%. The YOY increase in combined net trade of U.S. pork, beef and broilers was the largest experienced throughout the past three years.