U.S. Dairy Exports Update – Apr ’20
Executive Summary
U.S. dairy export figures provided by the USDA were recently updated with values spanning through Feb ’20. Highlights from the updated report include:
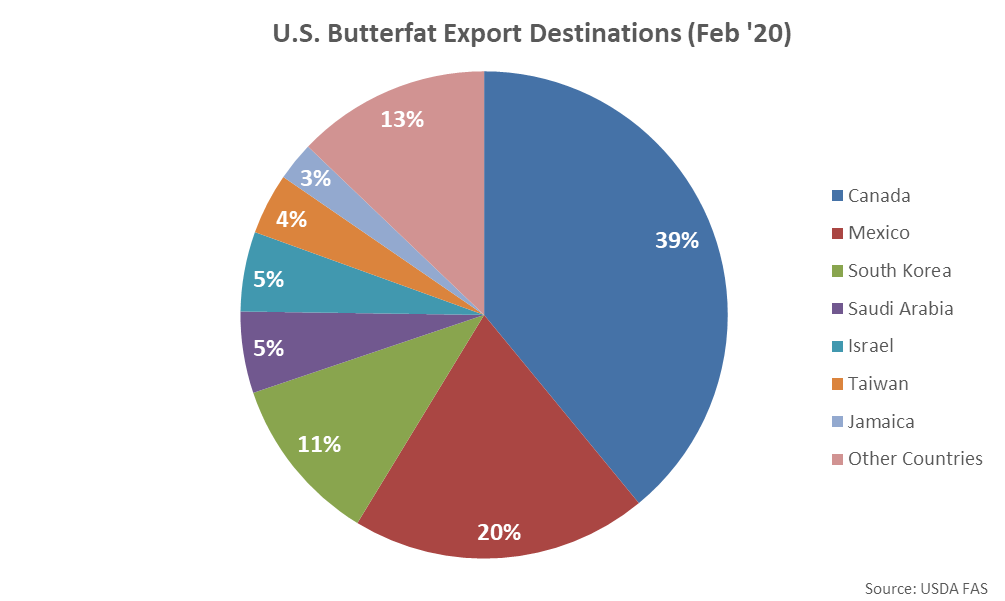
 Canada and Mexico were the top destinations for U.S. butterfat export volumes throughout Feb ’20, combining to account for over half of the total export volumes.
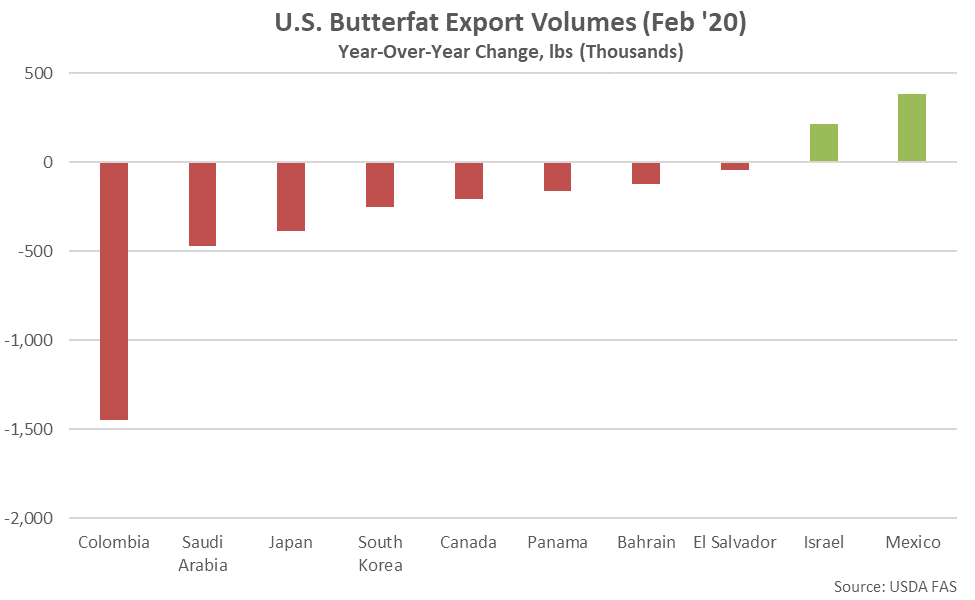
 Butterfat export volumes destined to Columbia declined most significantly on a YOY basis throughout the month, followed by volumes destined to Saudi Arabia, while butterfat export volumes destined to Mexico finished most significantly higher.
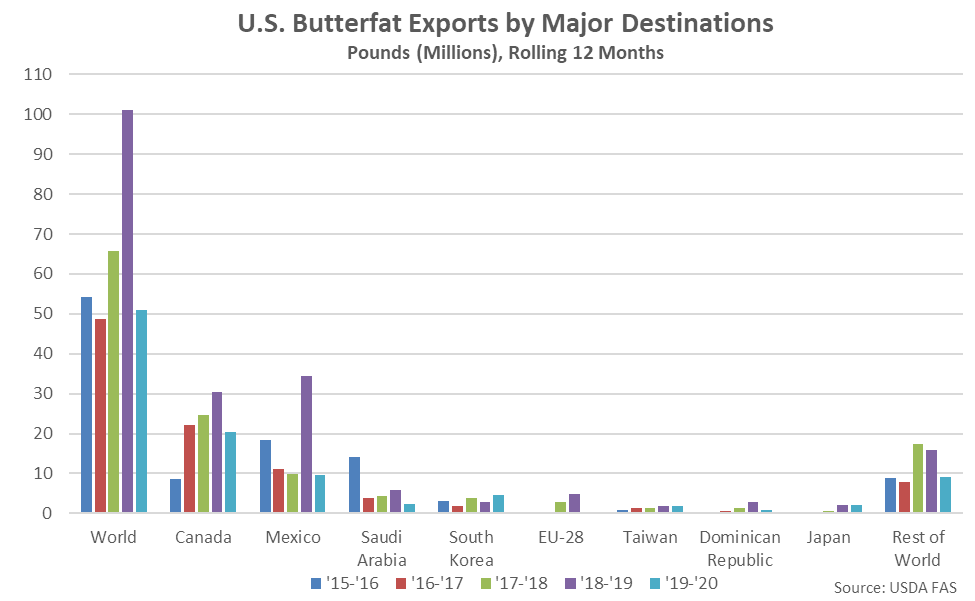
 Canada and Mexico have historically been the largest importers of U.S. butterfat, accounting for over half of the total U.S. export volumes experienced throughout the past five years. U.S. butterfat export volumes destined to Canada and Mexico have declined by 32.8% and 72.5%, respectively, on a YOY basis throughout the past 12 months, compared to a 42.1% YOY decline in U.S. butterfat export volumes destined to all other countries.
 Cheese – Export Volumes Decline YOY for the Second Time in Three Months, Finish Down 8.2%
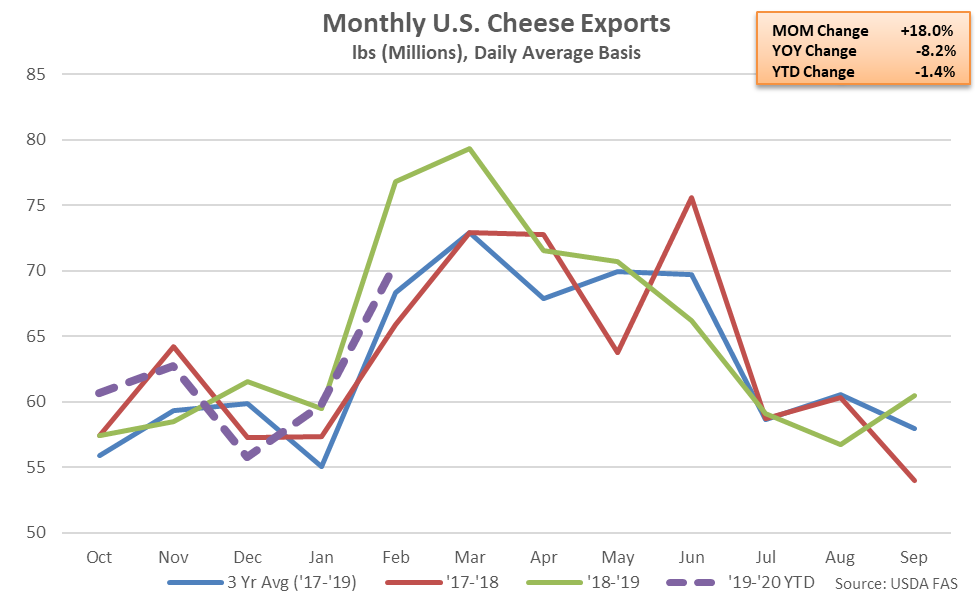
U.S. cheese export volumes declined on a YOY basis for the second time in the past three months during Feb ’20, finishing down 8.2%. Other-than-cheddar cheese export volumes declined 1.7% on a YOY basis throughout the month while cheddar cheese export volumes finished 43.2% lower YOY. The YOY decline in cheddar cheese export volumes was the fifth experienced in a row.
’18-’19 annual cheese export volumes increased 2.3% on a YOY basis, reaching a five year high level. ’19-’20 YTD cheese export volumes have declined by 1.4% on a YOY basis throughout the first five months of the production season, however.
Cheese – Export Volumes Decline YOY for the Second Time in Three Months, Finish Down 8.2%
U.S. cheese export volumes declined on a YOY basis for the second time in the past three months during Feb ’20, finishing down 8.2%. Other-than-cheddar cheese export volumes declined 1.7% on a YOY basis throughout the month while cheddar cheese export volumes finished 43.2% lower YOY. The YOY decline in cheddar cheese export volumes was the fifth experienced in a row.
’18-’19 annual cheese export volumes increased 2.3% on a YOY basis, reaching a five year high level. ’19-’20 YTD cheese export volumes have declined by 1.4% on a YOY basis throughout the first five months of the production season, however.
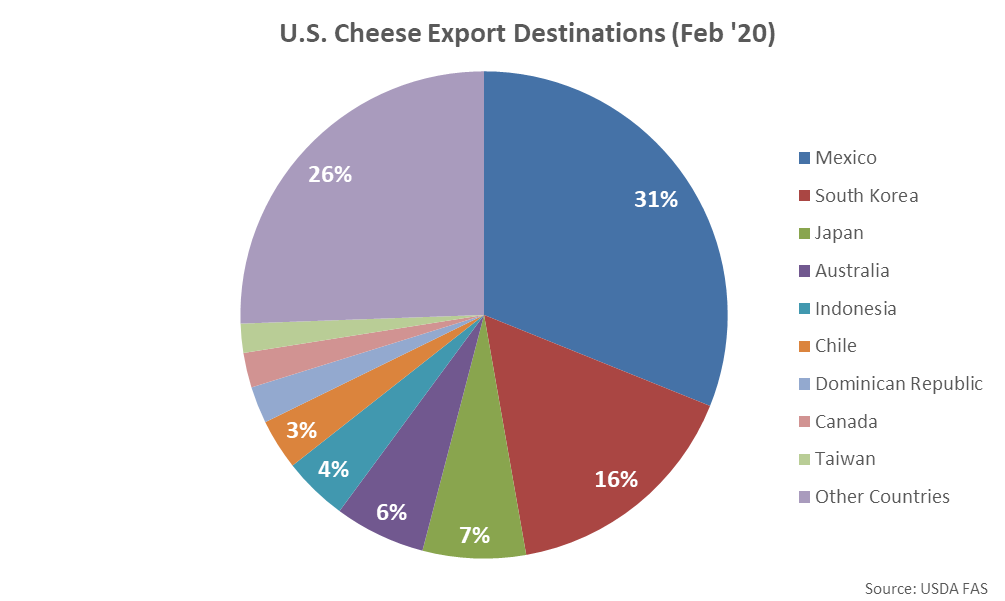
 Mexico was the top destination for U.S. cheese export volumes throughout Feb ’20, accounting for nearly a third of the total export volumes. Mexico, South Korea and Japan combined to account for over half of the total Feb ’20 U.S. cheese exports volumes.
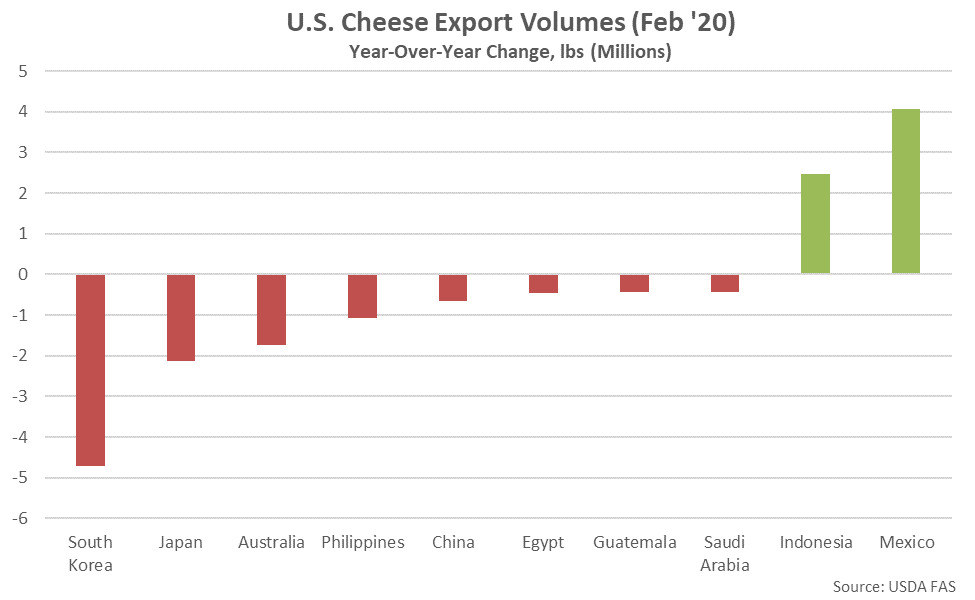
 YOY declines in cheese export volumes were led by product destined to South Korea, while volumes destined to Mexico finished most significantly higher on a YOY basis throughout the month.
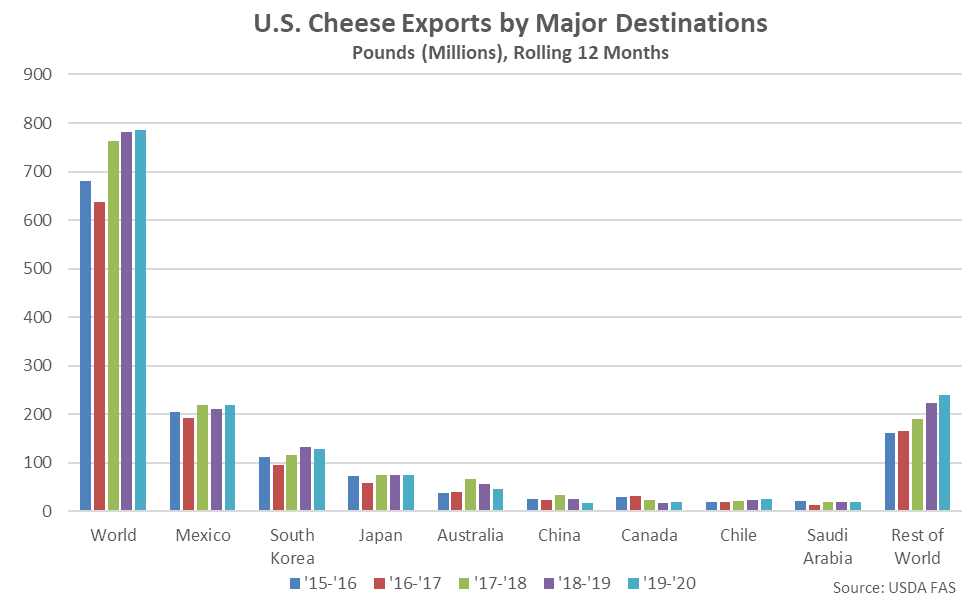
 Mexico and South Korea have historically been the largest importers of U.S. cheese, accounting for 45% of total U.S. cheese export volumes throughout the past five years. Combined U.S. cheese export volumes destined to Mexico and South Korea have increased 0.7% on a YOY basis throughout the past 12 months.
 Whey – Dry Whey and Whey Protein Concentrate Volumes Each Finish Higher YOY
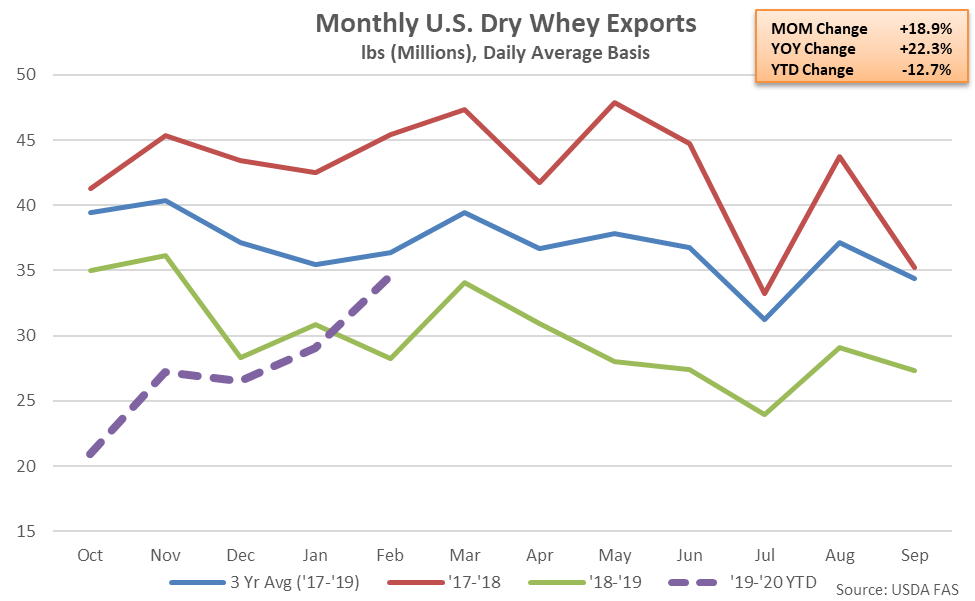
U.S. dry whey export volumes increased on a YOY basis for the first time in the past 18 months during Feb ’20, finishing up 22.3%. Dry whey export volumes remained 5.1% below three year average seasonal figures for the month of February, however.
’18-’19 annual dry whey export volumes declined 29.8% from the four year high level experienced throughout the previous production season, finishing at a 15 year low level. ’19-’20 YTD dry whey export volumes have declined by an additional 12.7% on a YOY basis throughout the first five months of the production season and are on pace to reach a 16 year low level, despite increasing on a YOY basis throughout the month of February.
Whey – Dry Whey and Whey Protein Concentrate Volumes Each Finish Higher YOY
U.S. dry whey export volumes increased on a YOY basis for the first time in the past 18 months during Feb ’20, finishing up 22.3%. Dry whey export volumes remained 5.1% below three year average seasonal figures for the month of February, however.
’18-’19 annual dry whey export volumes declined 29.8% from the four year high level experienced throughout the previous production season, finishing at a 15 year low level. ’19-’20 YTD dry whey export volumes have declined by an additional 12.7% on a YOY basis throughout the first five months of the production season and are on pace to reach a 16 year low level, despite increasing on a YOY basis throughout the month of February.
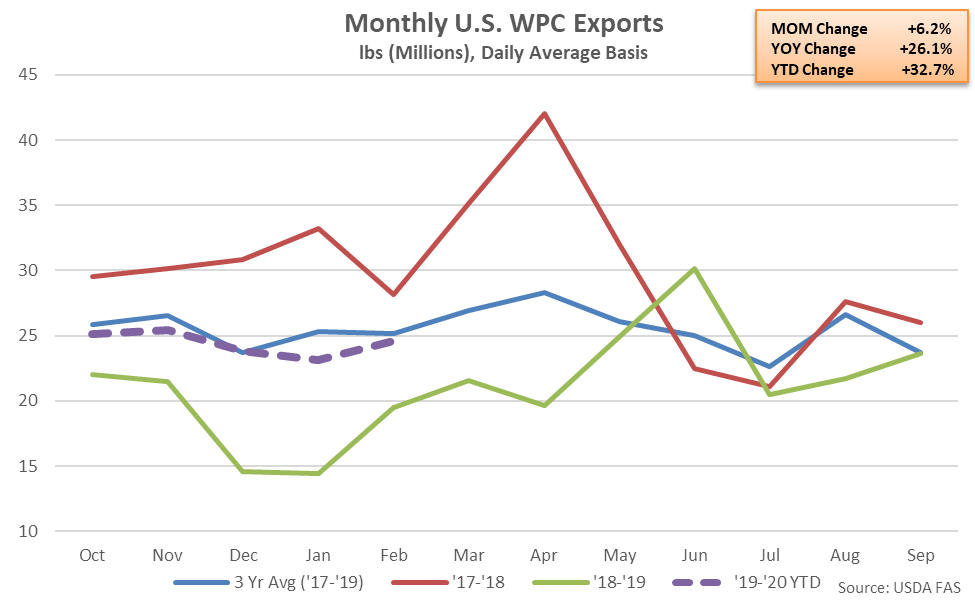
 U.S. whey protein concentrate (WPC) export volumes increased 26.1% on a YOY basis during Feb ’20, finishing higher for the fifth consecutive month. WPC export volumes had finished lower on a YOY basis over 11 of 12 months prior to increasing throughout the past five months.
’18-’19 annual WPC export volumes declined 29.1% from the record high level experienced throughout the previous production season, finishing at a four year low level. ’19-’20 YTD WPC export volumes have rebounded by 32.7% on a YOY basis throughout the first five months of the production season, however.
U.S. whey protein concentrate (WPC) export volumes increased 26.1% on a YOY basis during Feb ’20, finishing higher for the fifth consecutive month. WPC export volumes had finished lower on a YOY basis over 11 of 12 months prior to increasing throughout the past five months.
’18-’19 annual WPC export volumes declined 29.1% from the record high level experienced throughout the previous production season, finishing at a four year low level. ’19-’20 YTD WPC export volumes have rebounded by 32.7% on a YOY basis throughout the first five months of the production season, however.
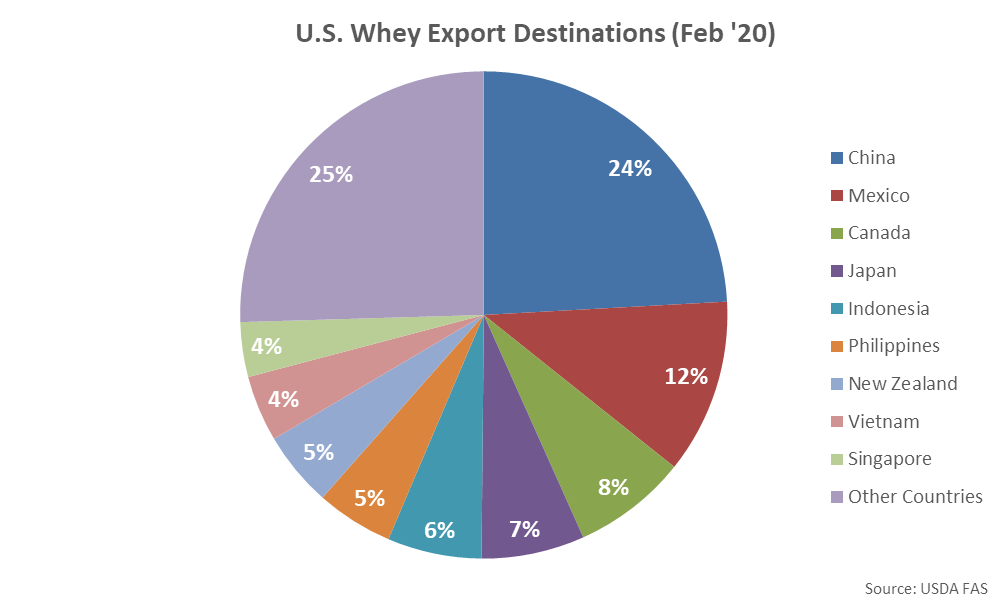
 China was the top destination for U.S. whey export volumes throughout Feb ’20, accounting for nearly a quarter of the total export volumes. China, Mexico, Canada and Japan combined to account for over half of the total Feb ’20 U.S. whey exports volumes.
 YOY increases in whey export volumes were led by product destined to China, while volumes destined to Mexico and the Philippines finished most significantly lower on a YOY basis throughout the month.
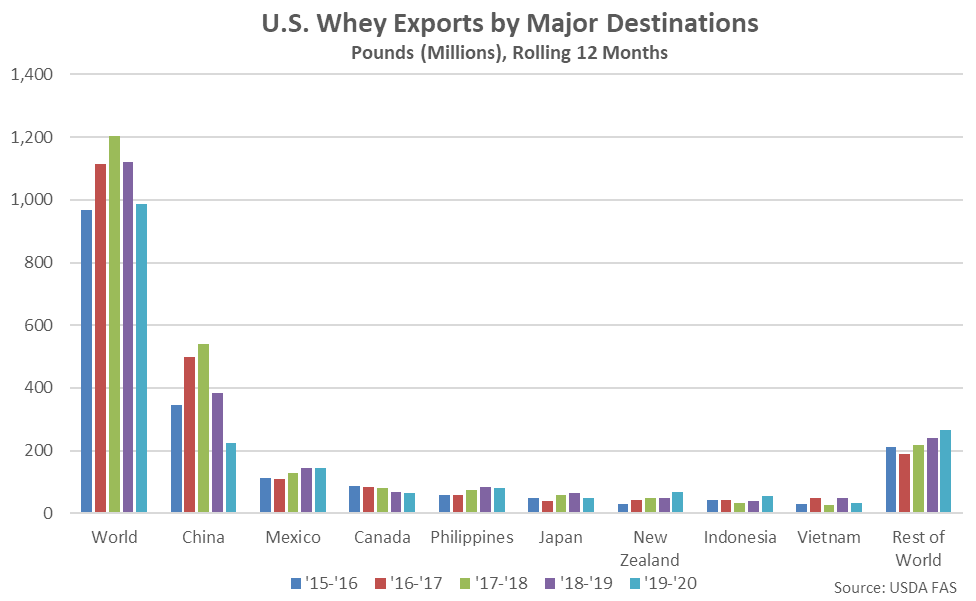
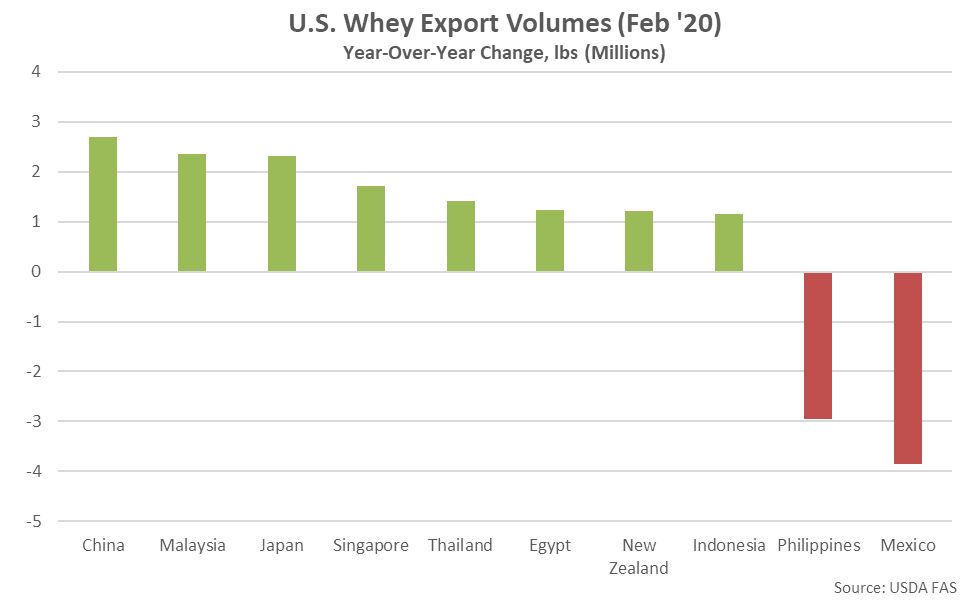 China has historically been the largest importer of U.S. whey products, accounting for over a third of the total U.S. whey export volumes throughout the past five years. U.S. whey export volumes destined to China have declined 41.8% YOY throughout the past 12 months, more than offsetting a 3.4% YOY increase in whey export volumes destined to all other countries over the same period. China applied a 25% retaliatory tariff to a wide variety of U.S. dairy products including whey during early Jul ’18 while Chinese whey demand has also been reduced on weaker feed demand due to African swine fever.
 NFDM/SMP – Export Volumes Decline YOY for the First Time in Six Months, Finish Down 4.7% YOY
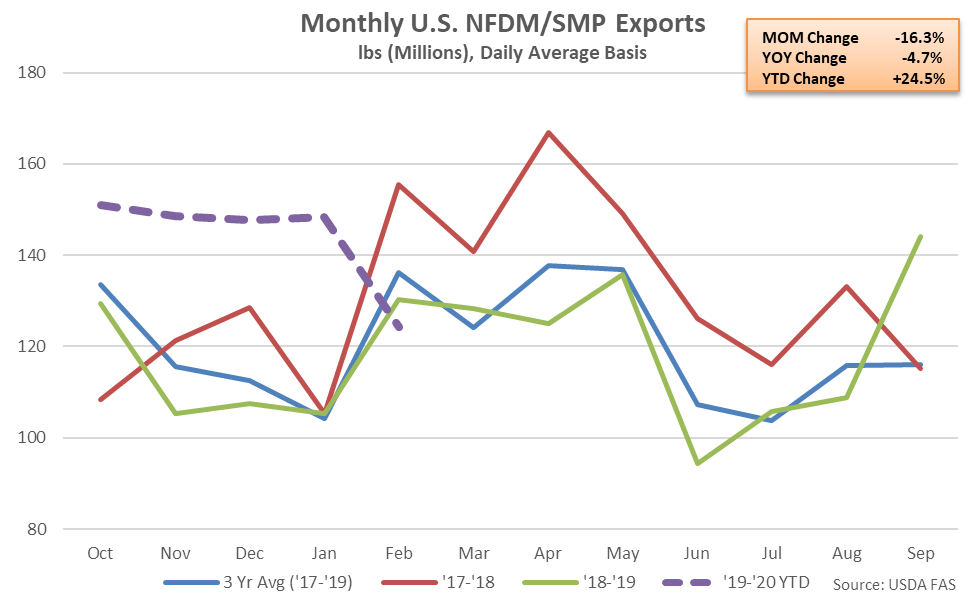
U.S. export volumes of nonfat dry milk (NFDM) and skim milk powder (SMP) finished lower on a YOY basis for the first time in the past six months during Feb ’20, declining by 4.7% and reaching a three year low seasonal level. U.S. NFDM/SMP export volumes had finished at record high seasonal levels over three consecutive months through Jan ’20, prior to declining throughout the month of February.
’18-’19 annual NFDM/SMP exports declined 9.4% from the record high level experienced throughout the previous production season but remained at the second highest annual figure on record. ’19-’20 YTD NFDM/SMP export volumes have rebounded by 24.5% on a YOY basis throughout the first five months of the production season and remain on pace to reach a record high level, despite declining on a YOY basis throughout the month of February.
NFDM/SMP – Export Volumes Decline YOY for the First Time in Six Months, Finish Down 4.7% YOY
U.S. export volumes of nonfat dry milk (NFDM) and skim milk powder (SMP) finished lower on a YOY basis for the first time in the past six months during Feb ’20, declining by 4.7% and reaching a three year low seasonal level. U.S. NFDM/SMP export volumes had finished at record high seasonal levels over three consecutive months through Jan ’20, prior to declining throughout the month of February.
’18-’19 annual NFDM/SMP exports declined 9.4% from the record high level experienced throughout the previous production season but remained at the second highest annual figure on record. ’19-’20 YTD NFDM/SMP export volumes have rebounded by 24.5% on a YOY basis throughout the first five months of the production season and remain on pace to reach a record high level, despite declining on a YOY basis throughout the month of February.
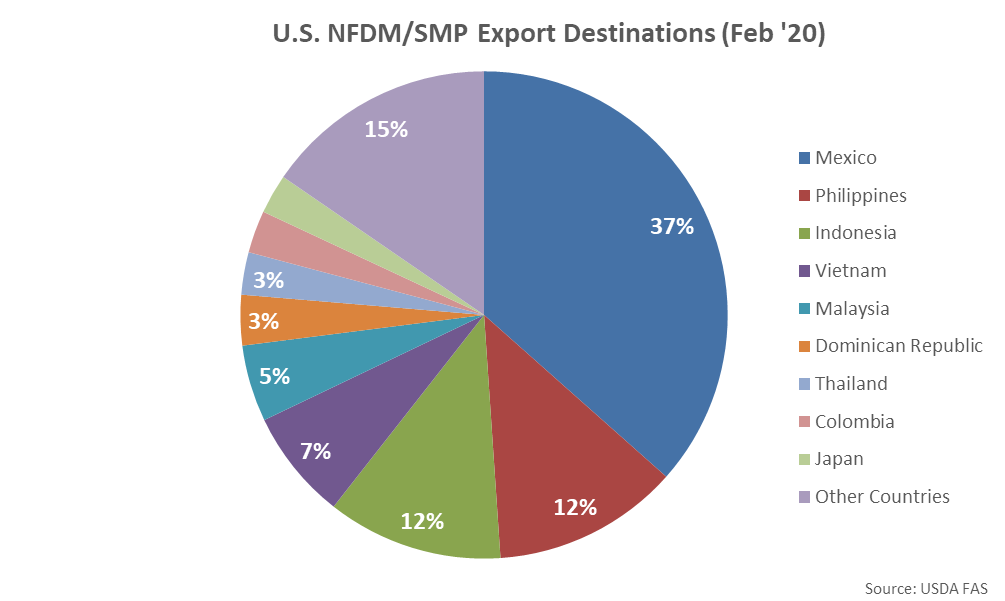
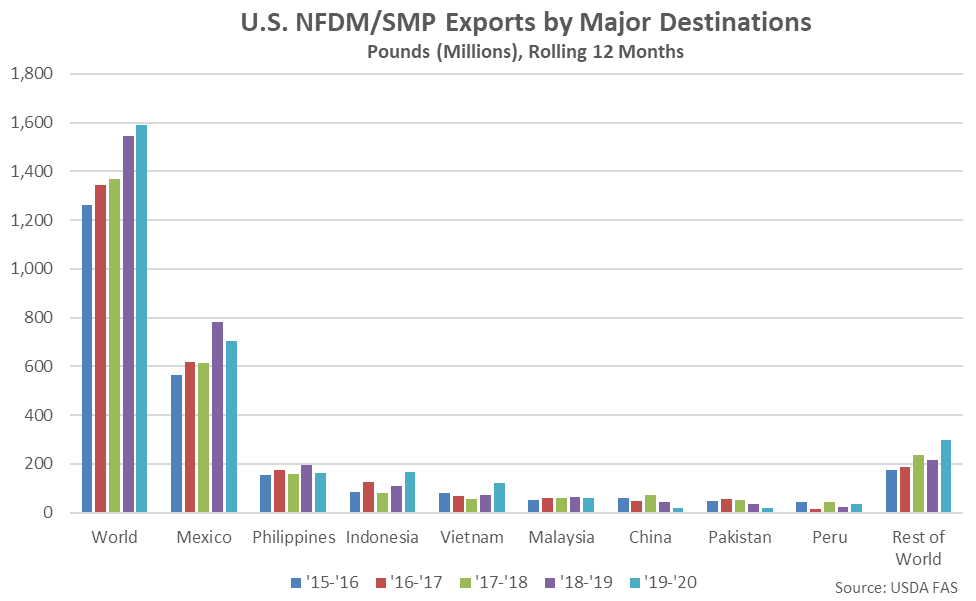
 Mexico was the top destination for U.S. NFDM/SMP export volumes throughout Feb ’20, accounting for over a third of the total export volumes. Mexico, the Philippines and Indonesia combined to account for over half of the total Feb ’20 U.S. NFDM/SMP exports volumes.
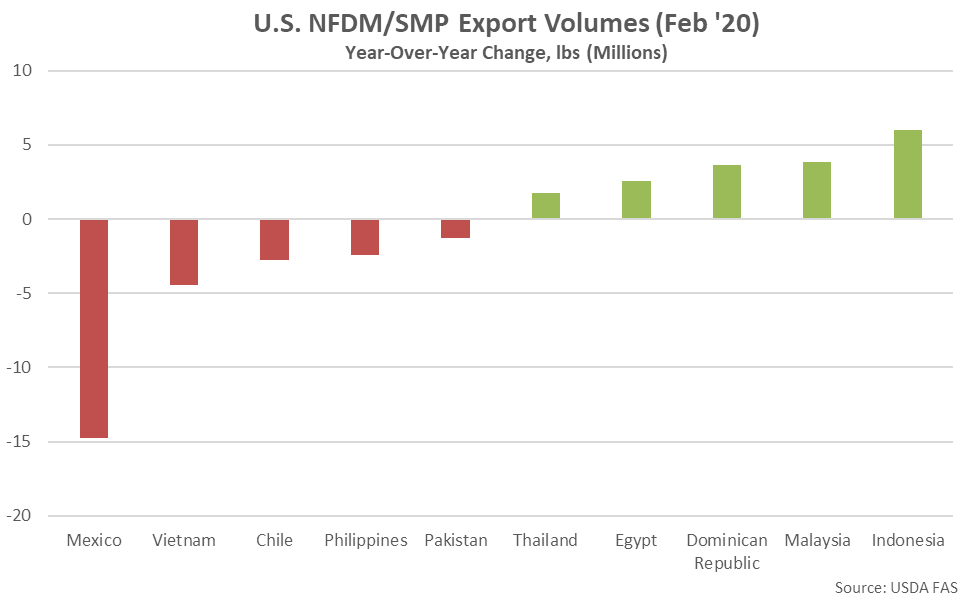
 YOY declines in NFDM/SMP export volumes were led by product destined to Mexico, followed by volumes destined to Vietnam, while export volumes destined to Indonesia finished most significantly higher on a YOY basis throughout the month.
 Mexico has historically been the largest importer of U.S. NFDM/SMP, accounting for nearly half of all U.S. NFDM/SMP export volumes throughout the past five years. U.S. NFDM/SMP export volumes destined to Mexico have declined 9.9% on a YOY basis throughout the past 12 months while volumes destined to all other countries have increased 15.6% YOY over the same period.
 Export Volumes Normalized to Production
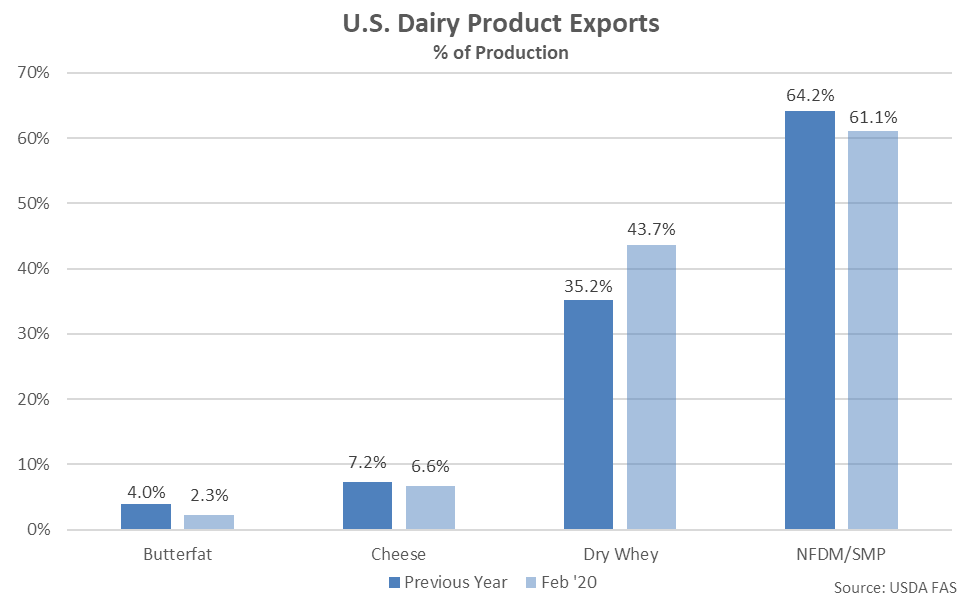
U.S. dry whey export volumes as a percentage of production finished above previous year figures during Feb ’20 however butterfat, cheese and NFDM/SMP export volumes as a percentage of production remained lower on a YOY basis.
Export Volumes Normalized to Production
U.S. dry whey export volumes as a percentage of production finished above previous year figures during Feb ’20 however butterfat, cheese and NFDM/SMP export volumes as a percentage of production remained lower on a YOY basis.
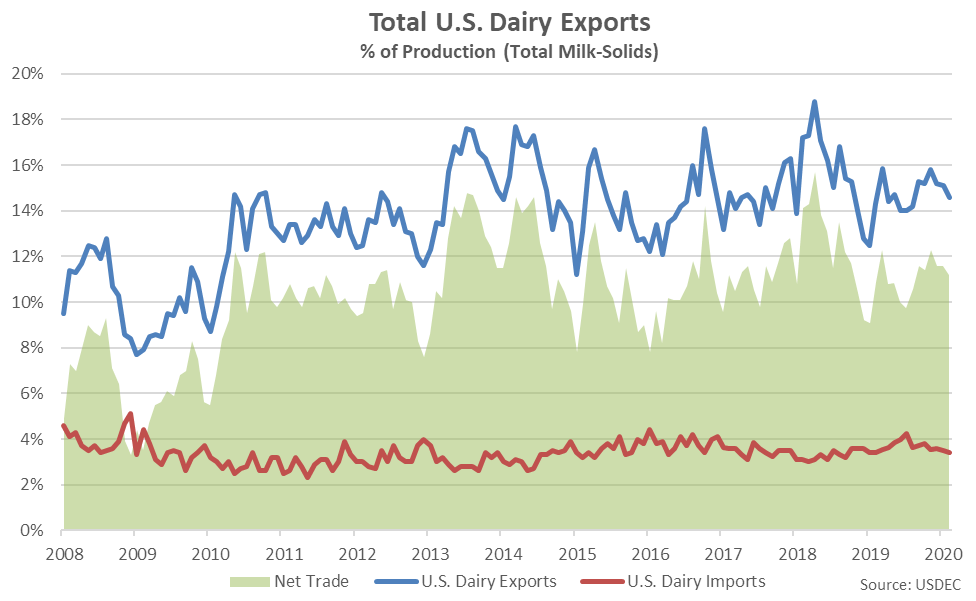
 Overall, U.S. dairy export volumes were estimated to be equivalent to approximately 14.6% of total U.S. milk-solids production during Feb ’20 while dairy import volumes were estimated to be equivalent to approximately 3.4% of total U.S. milk-solids production. Feb ’20 net dairy trade was estimated to increase 2.8% on a YOY basis, finishing higher for the fourth consecutive month. Net dairy trade had finished lower on a YOY basis over 12 consecutive months prior to increasing YOY over the four most recent months.
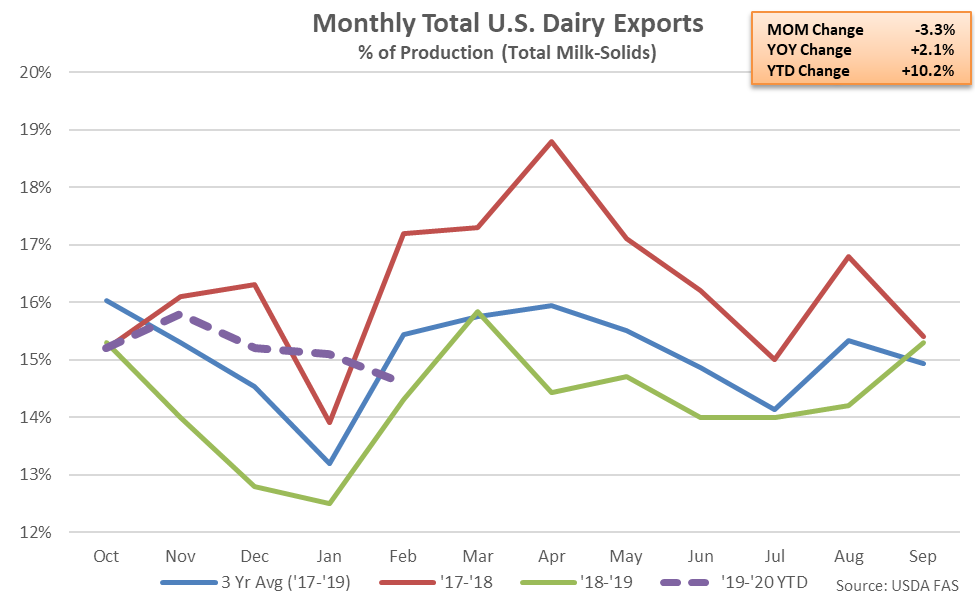
 U.S. dairy exports as a percentage of milk-solids production increased on a YOY basis for the fourth consecutive month during Feb ’20, finishing up 2.1%. ’18-’19 annual dairy exports as a percentage of milk-solids production declined 12.3% from the record high level experienced throughout the previous production season, finishing at a three year low, however ’19-’20 YTD figures have rebounded by 10.2% on a YOY basis throughout the first five months of the production season.
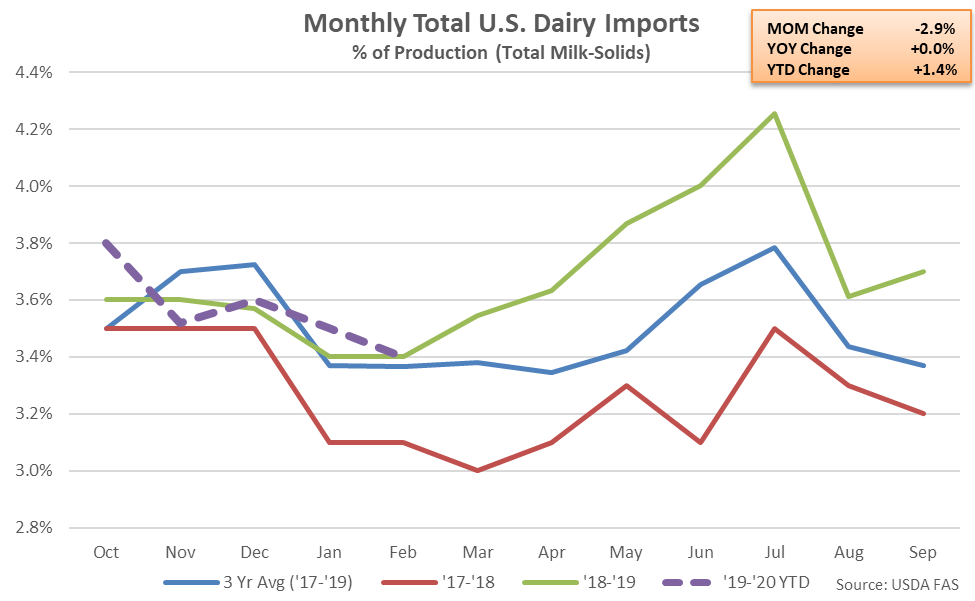
 U.S. dairy imports as a percentage of milk-solids production finished flat on a YOY basis throughout Feb ’20. ’18-’19 annual dairy imports as a percentage of milk-solids production rebounded 12.7% from the four year low level experienced throughout the previous production season, reaching a three year high, while ’19-’20 YTD figures have increased on additional 1.4% on a YOY basis throughout the first five months of the production season.
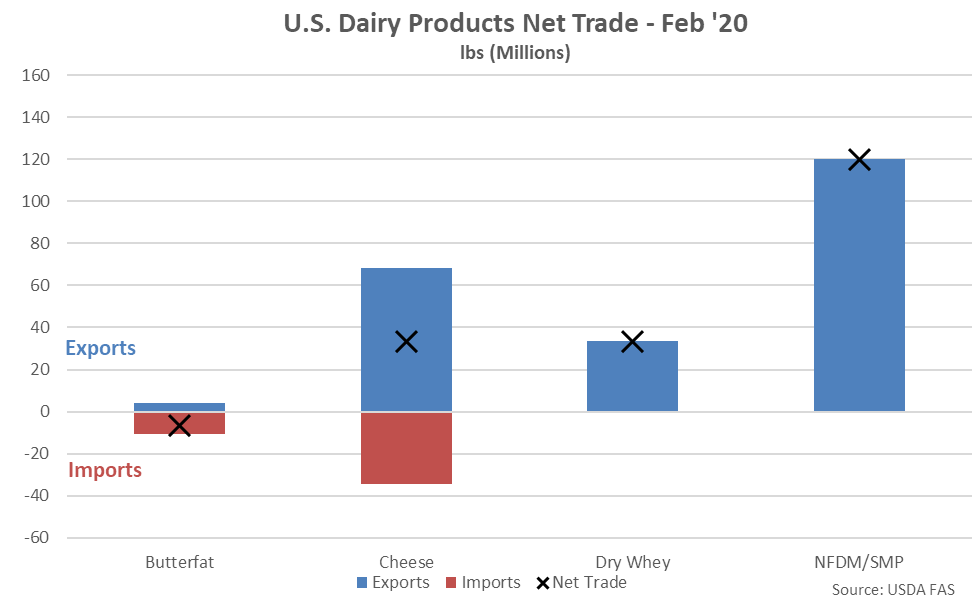
 Net trade of U.S. NFDM/SMP continued to outpace that of butter, cheese and dry whey as import volumes remain minimal. Net cheese trade volumes exceeded net dry whey trade volumes for the second consecutive month during Feb ’20 while the U.S. finished as a net importer of butter for the 22nd consecutive month.
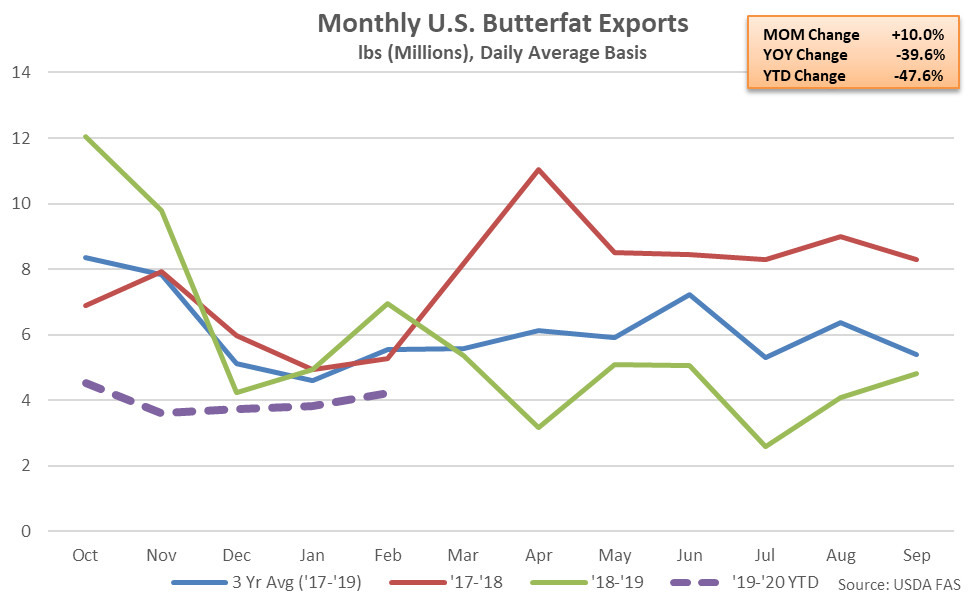
- U.S. butterfat export volumes declined on a YOY basis for the 12th consecutive month during Feb ’20, finishing down 39.6% and reaching a 13 year seasonal low level. U.S. cheese export volumes declined 8.2% on a YOY basis throughout the month, finishing lower for the second time in the past three months.
- U.S. dry whey export volumes increased 22.3% on a YOY basis during Feb ’20, finishing higher for the first time in the past 18 months, while whey protein concentrate export volumes increased 26.1% YOY, finishing higher for the fifth consecutive month. U.S. nonfat dry milk/skim milk powder export volumes declined on a YOY basis for the first time in the past six months, however, finishing down 4.7%.
- Net dairy trade on a percentage of total U.S. milk-solids production basis increased on a YOY basis for the fourth consecutive month during Feb ’20, finishing up 2.8%.
Canada and Mexico were the top destinations for U.S. butterfat export volumes throughout Feb ’20, combining to account for over half of the total export volumes.
Butterfat export volumes destined to Columbia declined most significantly on a YOY basis throughout the month, followed by volumes destined to Saudi Arabia, while butterfat export volumes destined to Mexico finished most significantly higher.
Canada and Mexico have historically been the largest importers of U.S. butterfat, accounting for over half of the total U.S. export volumes experienced throughout the past five years. U.S. butterfat export volumes destined to Canada and Mexico have declined by 32.8% and 72.5%, respectively, on a YOY basis throughout the past 12 months, compared to a 42.1% YOY decline in U.S. butterfat export volumes destined to all other countries.
Cheese – Export Volumes Decline YOY for the Second Time in Three Months, Finish Down 8.2%
U.S. cheese export volumes declined on a YOY basis for the second time in the past three months during Feb ’20, finishing down 8.2%. Other-than-cheddar cheese export volumes declined 1.7% on a YOY basis throughout the month while cheddar cheese export volumes finished 43.2% lower YOY. The YOY decline in cheddar cheese export volumes was the fifth experienced in a row.
’18-’19 annual cheese export volumes increased 2.3% on a YOY basis, reaching a five year high level. ’19-’20 YTD cheese export volumes have declined by 1.4% on a YOY basis throughout the first five months of the production season, however.
Mexico was the top destination for U.S. cheese export volumes throughout Feb ’20, accounting for nearly a third of the total export volumes. Mexico, South Korea and Japan combined to account for over half of the total Feb ’20 U.S. cheese exports volumes.
YOY declines in cheese export volumes were led by product destined to South Korea, while volumes destined to Mexico finished most significantly higher on a YOY basis throughout the month.
Mexico and South Korea have historically been the largest importers of U.S. cheese, accounting for 45% of total U.S. cheese export volumes throughout the past five years. Combined U.S. cheese export volumes destined to Mexico and South Korea have increased 0.7% on a YOY basis throughout the past 12 months.
Whey – Dry Whey and Whey Protein Concentrate Volumes Each Finish Higher YOY
U.S. dry whey export volumes increased on a YOY basis for the first time in the past 18 months during Feb ’20, finishing up 22.3%. Dry whey export volumes remained 5.1% below three year average seasonal figures for the month of February, however.
’18-’19 annual dry whey export volumes declined 29.8% from the four year high level experienced throughout the previous production season, finishing at a 15 year low level. ’19-’20 YTD dry whey export volumes have declined by an additional 12.7% on a YOY basis throughout the first five months of the production season and are on pace to reach a 16 year low level, despite increasing on a YOY basis throughout the month of February.
U.S. whey protein concentrate (WPC) export volumes increased 26.1% on a YOY basis during Feb ’20, finishing higher for the fifth consecutive month. WPC export volumes had finished lower on a YOY basis over 11 of 12 months prior to increasing throughout the past five months.
’18-’19 annual WPC export volumes declined 29.1% from the record high level experienced throughout the previous production season, finishing at a four year low level. ’19-’20 YTD WPC export volumes have rebounded by 32.7% on a YOY basis throughout the first five months of the production season, however.
China was the top destination for U.S. whey export volumes throughout Feb ’20, accounting for nearly a quarter of the total export volumes. China, Mexico, Canada and Japan combined to account for over half of the total Feb ’20 U.S. whey exports volumes.
YOY increases in whey export volumes were led by product destined to China, while volumes destined to Mexico and the Philippines finished most significantly lower on a YOY basis throughout the month.
China has historically been the largest importer of U.S. whey products, accounting for over a third of the total U.S. whey export volumes throughout the past five years. U.S. whey export volumes destined to China have declined 41.8% YOY throughout the past 12 months, more than offsetting a 3.4% YOY increase in whey export volumes destined to all other countries over the same period. China applied a 25% retaliatory tariff to a wide variety of U.S. dairy products including whey during early Jul ’18 while Chinese whey demand has also been reduced on weaker feed demand due to African swine fever.
NFDM/SMP – Export Volumes Decline YOY for the First Time in Six Months, Finish Down 4.7% YOY
U.S. export volumes of nonfat dry milk (NFDM) and skim milk powder (SMP) finished lower on a YOY basis for the first time in the past six months during Feb ’20, declining by 4.7% and reaching a three year low seasonal level. U.S. NFDM/SMP export volumes had finished at record high seasonal levels over three consecutive months through Jan ’20, prior to declining throughout the month of February.
’18-’19 annual NFDM/SMP exports declined 9.4% from the record high level experienced throughout the previous production season but remained at the second highest annual figure on record. ’19-’20 YTD NFDM/SMP export volumes have rebounded by 24.5% on a YOY basis throughout the first five months of the production season and remain on pace to reach a record high level, despite declining on a YOY basis throughout the month of February.
Mexico was the top destination for U.S. NFDM/SMP export volumes throughout Feb ’20, accounting for over a third of the total export volumes. Mexico, the Philippines and Indonesia combined to account for over half of the total Feb ’20 U.S. NFDM/SMP exports volumes.
YOY declines in NFDM/SMP export volumes were led by product destined to Mexico, followed by volumes destined to Vietnam, while export volumes destined to Indonesia finished most significantly higher on a YOY basis throughout the month.
Mexico has historically been the largest importer of U.S. NFDM/SMP, accounting for nearly half of all U.S. NFDM/SMP export volumes throughout the past five years. U.S. NFDM/SMP export volumes destined to Mexico have declined 9.9% on a YOY basis throughout the past 12 months while volumes destined to all other countries have increased 15.6% YOY over the same period.
Export Volumes Normalized to Production
U.S. dry whey export volumes as a percentage of production finished above previous year figures during Feb ’20 however butterfat, cheese and NFDM/SMP export volumes as a percentage of production remained lower on a YOY basis.
Overall, U.S. dairy export volumes were estimated to be equivalent to approximately 14.6% of total U.S. milk-solids production during Feb ’20 while dairy import volumes were estimated to be equivalent to approximately 3.4% of total U.S. milk-solids production. Feb ’20 net dairy trade was estimated to increase 2.8% on a YOY basis, finishing higher for the fourth consecutive month. Net dairy trade had finished lower on a YOY basis over 12 consecutive months prior to increasing YOY over the four most recent months.
U.S. dairy exports as a percentage of milk-solids production increased on a YOY basis for the fourth consecutive month during Feb ’20, finishing up 2.1%. ’18-’19 annual dairy exports as a percentage of milk-solids production declined 12.3% from the record high level experienced throughout the previous production season, finishing at a three year low, however ’19-’20 YTD figures have rebounded by 10.2% on a YOY basis throughout the first five months of the production season.
U.S. dairy imports as a percentage of milk-solids production finished flat on a YOY basis throughout Feb ’20. ’18-’19 annual dairy imports as a percentage of milk-solids production rebounded 12.7% from the four year low level experienced throughout the previous production season, reaching a three year high, while ’19-’20 YTD figures have increased on additional 1.4% on a YOY basis throughout the first five months of the production season.
Net trade of U.S. NFDM/SMP continued to outpace that of butter, cheese and dry whey as import volumes remain minimal. Net cheese trade volumes exceeded net dry whey trade volumes for the second consecutive month during Feb ’20 while the U.S. finished as a net importer of butter for the 22nd consecutive month.