U.S. Dairy Exports Update – Sep ’20
Executive Summary
U.S. dairy export figures provided by the USDA were recently updated with values spanning through Jul ’20. Highlights from the updated report include:
 Canada and Saudi Arabia were the top destinations for U.S. butterfat export volumes throughout Jul ’20, combining to account for over half of the total export volumes.
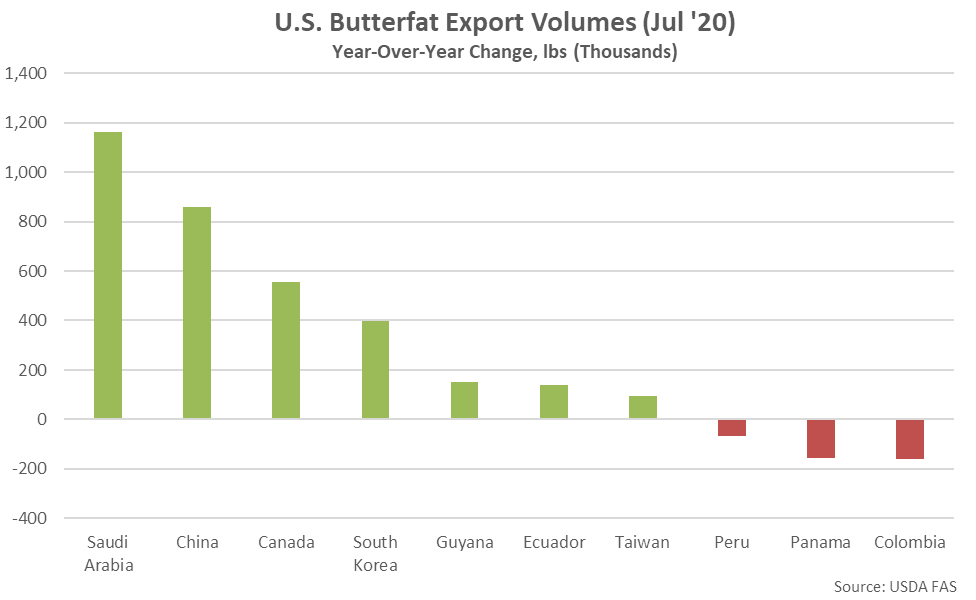
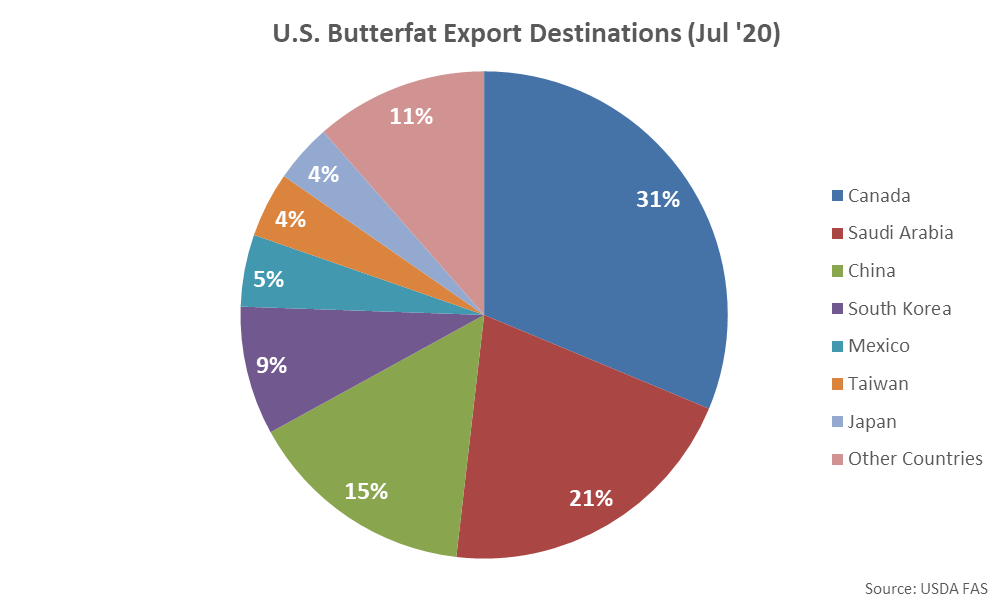 Butterfat export volumes destined to Saudi Arabia increased most significantly on a YOY basis throughout the month, followed by volumes destined to China and Canada, while butterfat export volumes destined to Columbia finished most significantly lower.
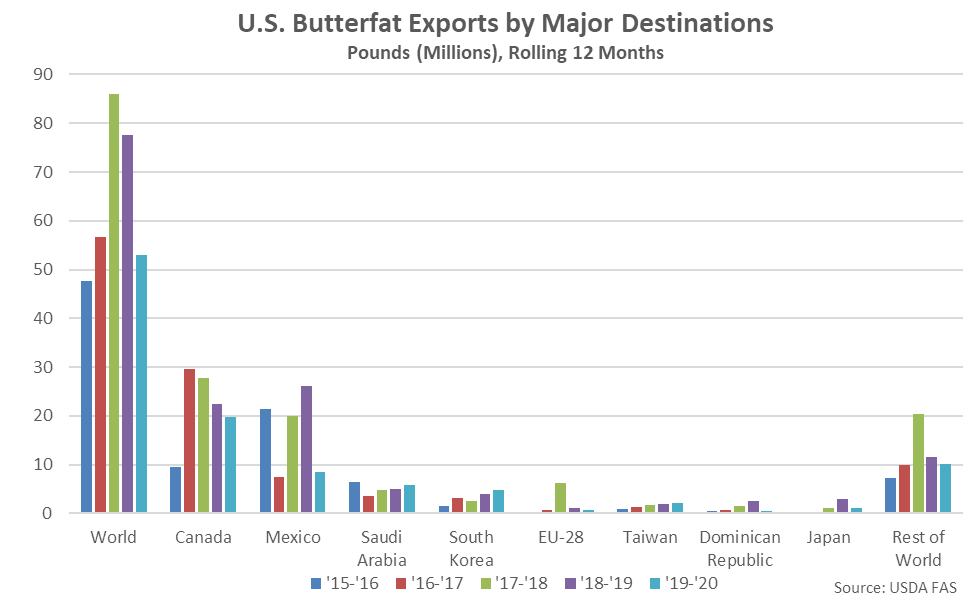
 Canada and Mexico have historically been the largest importers of U.S. butterfat, accounting for 60% of the total U.S. export volumes experienced throughout the past five years. U.S. butterfat export volumes destined to Canada and Mexico have declined by 12.3% and 67.8%, respectively, on a YOY basis throughout the past 12 months, compared to a 14.5% YOY decline in U.S. butterfat export volumes destined to all other countries.
 Cheese – Export Volumes Reach a Six Year High Seasonal Level Despite Lower Cheddar Volumes
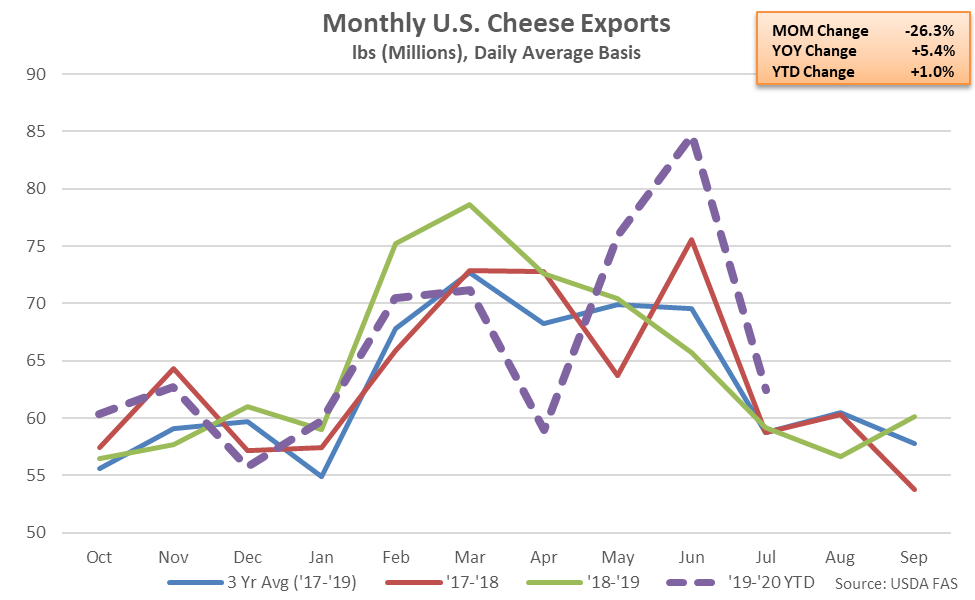
Jul ’20 U.S. cheese export volumes declined significantly from the record high level experienced throughout the previous month but remained 5.4% higher on a YOY basis, reaching a six year high seasonal level. Other-than-cheddar cheese export volumes increased 7.9% on a YOY basis throughout the month, more than offsetting a 10.0% YOY decline in cheddar cheese export volumes. The YOY decline in cheddar cheese export volumes was the seventh experienced throughout the past eight months.
’18-’19 annual cheese export volumes increased 1.7% on a YOY basis, reaching a five year high level. ’19-’20 YTD cheese export volumes have increased an additional 1.0% on a YOY basis throughout the first ten months of the production season.
Cheese – Export Volumes Reach a Six Year High Seasonal Level Despite Lower Cheddar Volumes
Jul ’20 U.S. cheese export volumes declined significantly from the record high level experienced throughout the previous month but remained 5.4% higher on a YOY basis, reaching a six year high seasonal level. Other-than-cheddar cheese export volumes increased 7.9% on a YOY basis throughout the month, more than offsetting a 10.0% YOY decline in cheddar cheese export volumes. The YOY decline in cheddar cheese export volumes was the seventh experienced throughout the past eight months.
’18-’19 annual cheese export volumes increased 1.7% on a YOY basis, reaching a five year high level. ’19-’20 YTD cheese export volumes have increased an additional 1.0% on a YOY basis throughout the first ten months of the production season.
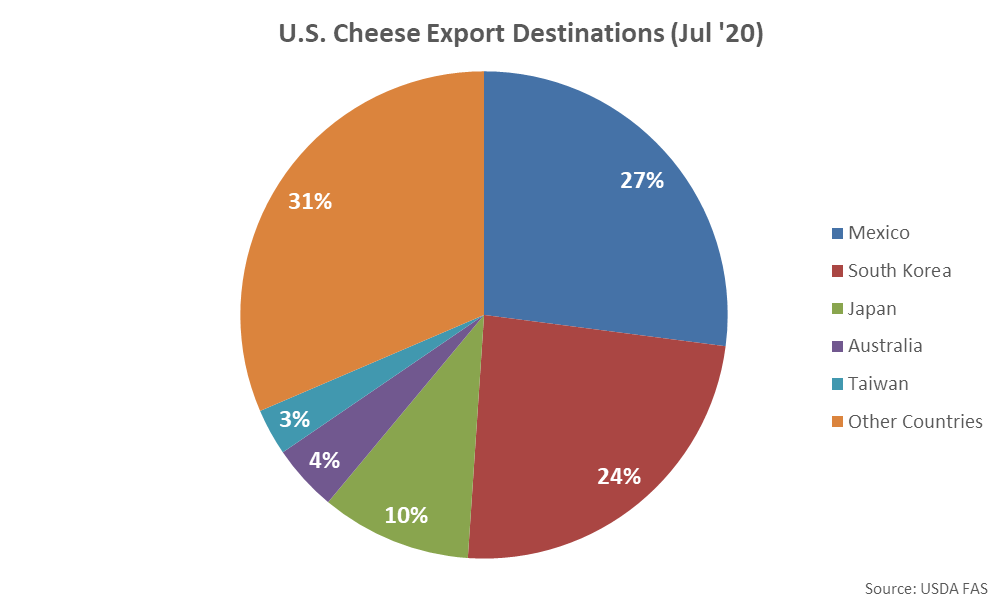
 Mexico and South Korea were the top destinations for U.S. cheese export volumes throughout Jul ’20, combining to account for over half of the total export volumes.
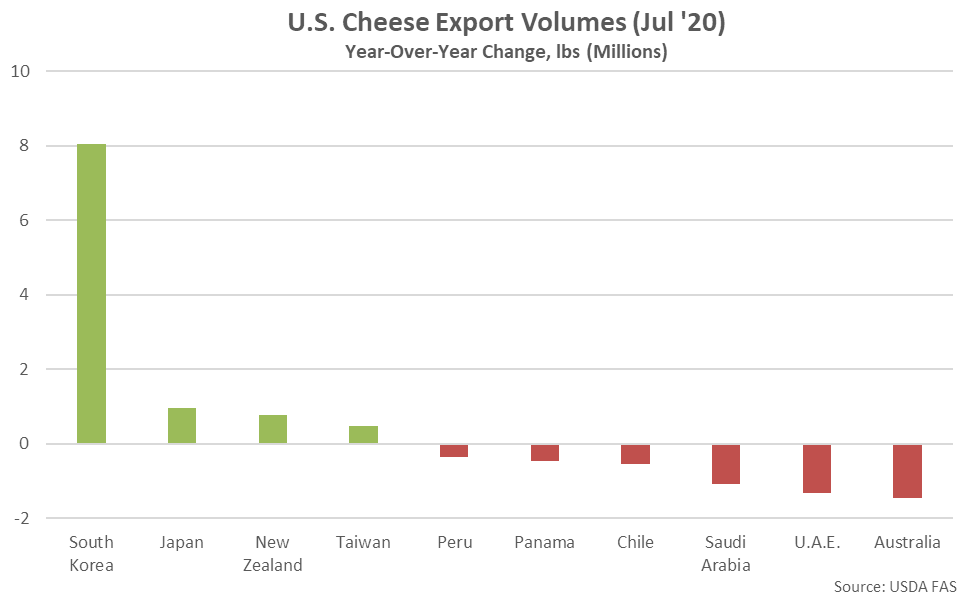
 YOY increases in cheese export volumes were led by product destined to South Korea, while volumes destined to Australia and the United Arab Emirates finished most significantly lower on a YOY basis throughout the month.
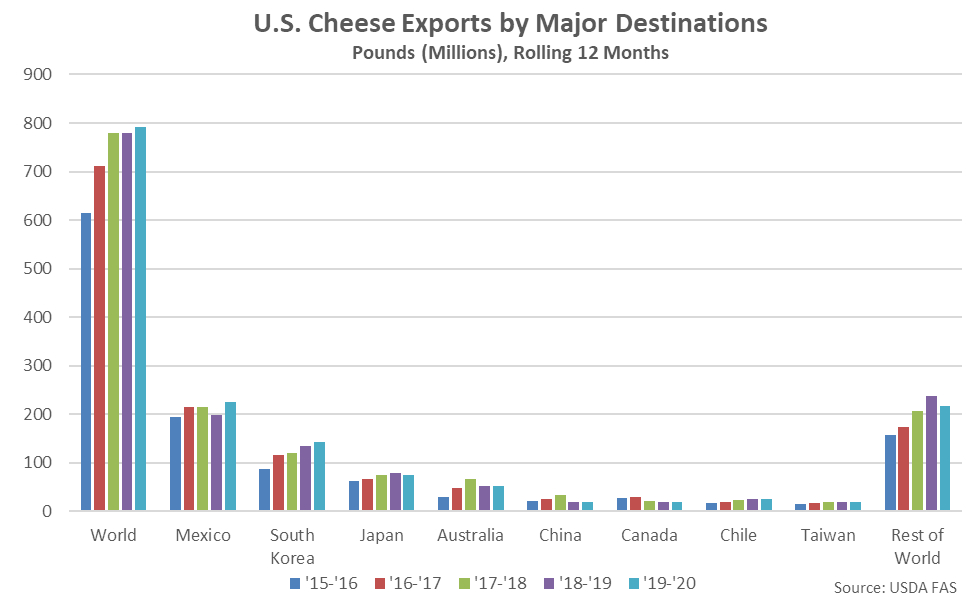
 Mexico and South Korea have historically been the largest importers of U.S. cheese, accounting for nearly 45% of total U.S. cheese export volumes throughout the past five years. Combined U.S. cheese export volumes destined to Mexico and South Korea have increased 9.9% on a YOY basis throughout the past 12 months.
 Whey – Dry Whey and Whey Protein Concentrate Export Volumes Each Finish Higher on a YOY Basis
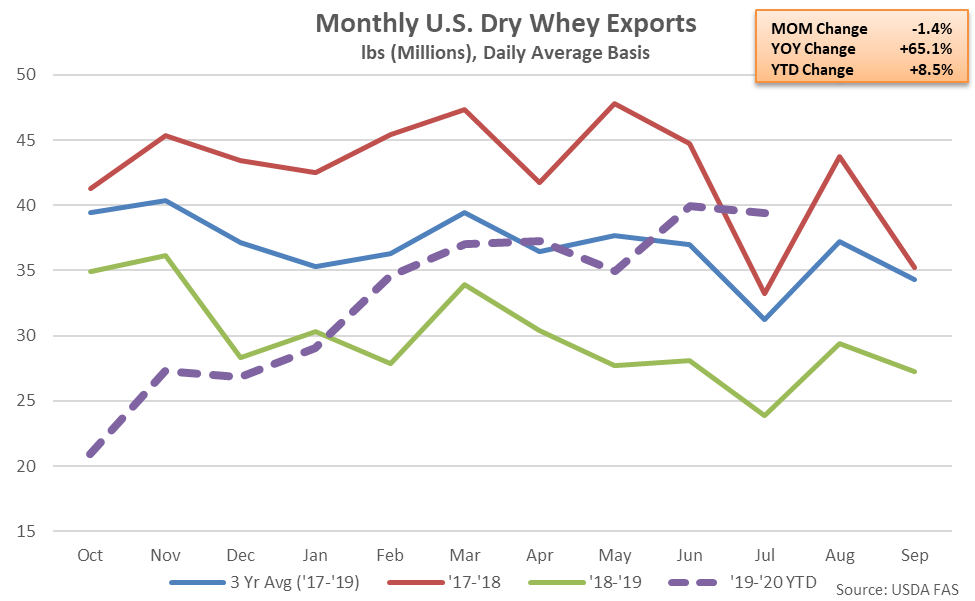
U.S. dry whey export volumes increased on a YOY basis for the sixth consecutive month during Jul ’20, finishing up 65.1% and reaching a seven year high seasonal level. Dry whey export volumes had finished lower on a YOY basis over 17 consecutive months prior to the six most recently experienced YOY increases. The Jul ’20 YOY increase in dry whey export volumes was the largest experienced throughout the past 15 years on a percentage basis.
’18-’19 annual dry whey export volumes declined 30.0% from the four year high level experienced throughout the previous production season, finishing at a 15 year low level. ’19-’20 YTD dry whey export volumes have rebounded by 8.5% on a YOY basis throughout the first ten months of the production season, however.
Whey – Dry Whey and Whey Protein Concentrate Export Volumes Each Finish Higher on a YOY Basis
U.S. dry whey export volumes increased on a YOY basis for the sixth consecutive month during Jul ’20, finishing up 65.1% and reaching a seven year high seasonal level. Dry whey export volumes had finished lower on a YOY basis over 17 consecutive months prior to the six most recently experienced YOY increases. The Jul ’20 YOY increase in dry whey export volumes was the largest experienced throughout the past 15 years on a percentage basis.
’18-’19 annual dry whey export volumes declined 30.0% from the four year high level experienced throughout the previous production season, finishing at a 15 year low level. ’19-’20 YTD dry whey export volumes have rebounded by 8.5% on a YOY basis throughout the first ten months of the production season, however.
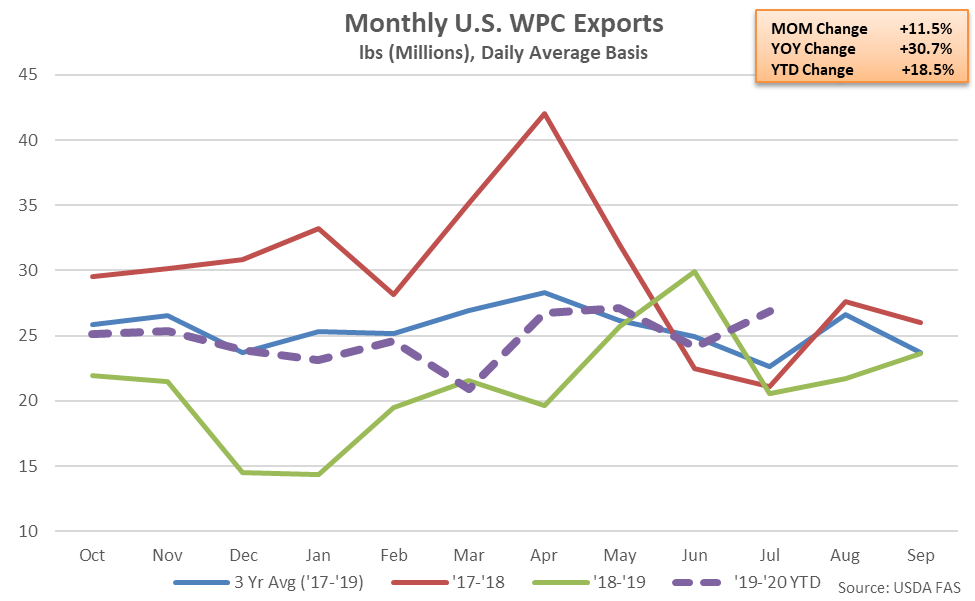
 U.S. whey protein concentrate (WPC) export volumes increased 30.7% on a YOY basis during Jul ’20, reaching an eight year high seasonal level. The YOY increase in WPC export volumes was the third experienced throughout the past four months.
’18-’19 annual WPC export volumes declined 28.9% from the record high level experienced throughout the previous production season, finishing at a four year low level. ’19-’20 YTD WPC export volumes have rebounded by 18.5% on a YOY basis throughout the first ten months of the production season.
U.S. whey protein concentrate (WPC) export volumes increased 30.7% on a YOY basis during Jul ’20, reaching an eight year high seasonal level. The YOY increase in WPC export volumes was the third experienced throughout the past four months.
’18-’19 annual WPC export volumes declined 28.9% from the record high level experienced throughout the previous production season, finishing at a four year low level. ’19-’20 YTD WPC export volumes have rebounded by 18.5% on a YOY basis throughout the first ten months of the production season.
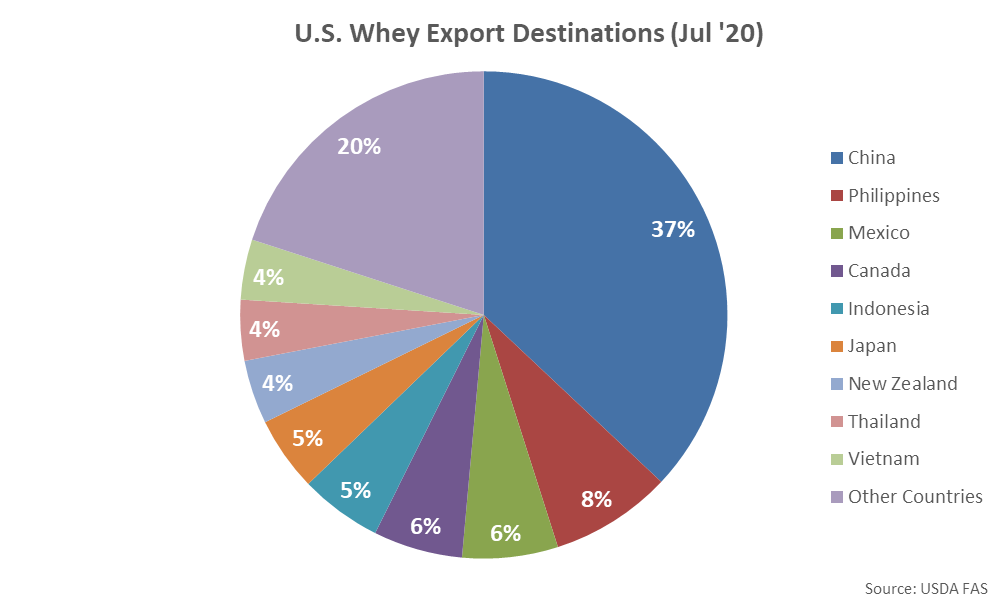
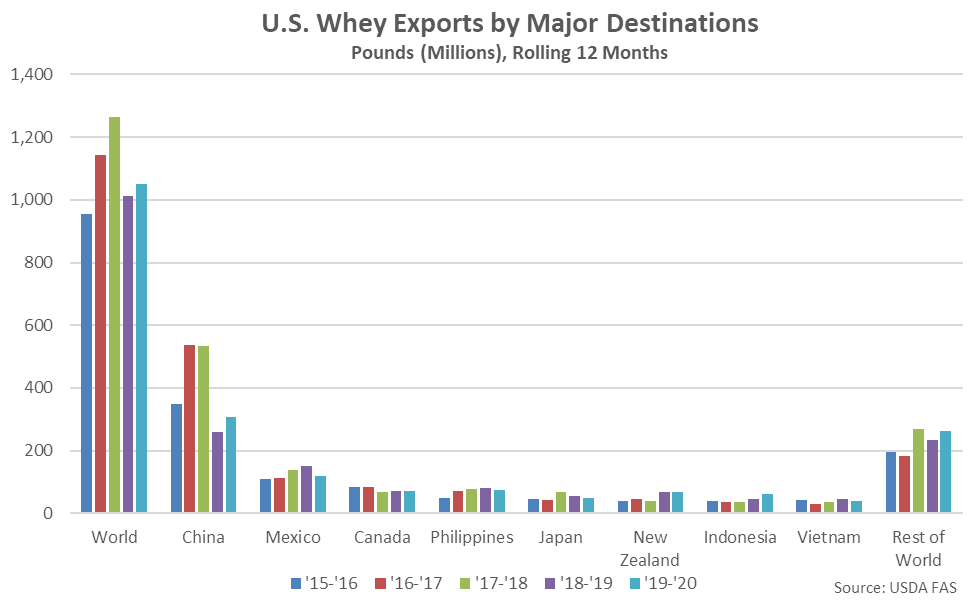
 China was the top destination for U.S. whey export volumes throughout Jul ’20, accounting for over a third of the total export volumes. China, the Philippines and Mexico combined to account for over half of the total Jul ’20 U.S. whey exports volumes.
 YOY increases in whey export volumes continue to be led by product destined to China, while volumes destined to Mexico finished most significantly lower on a YOY basis throughout the month.
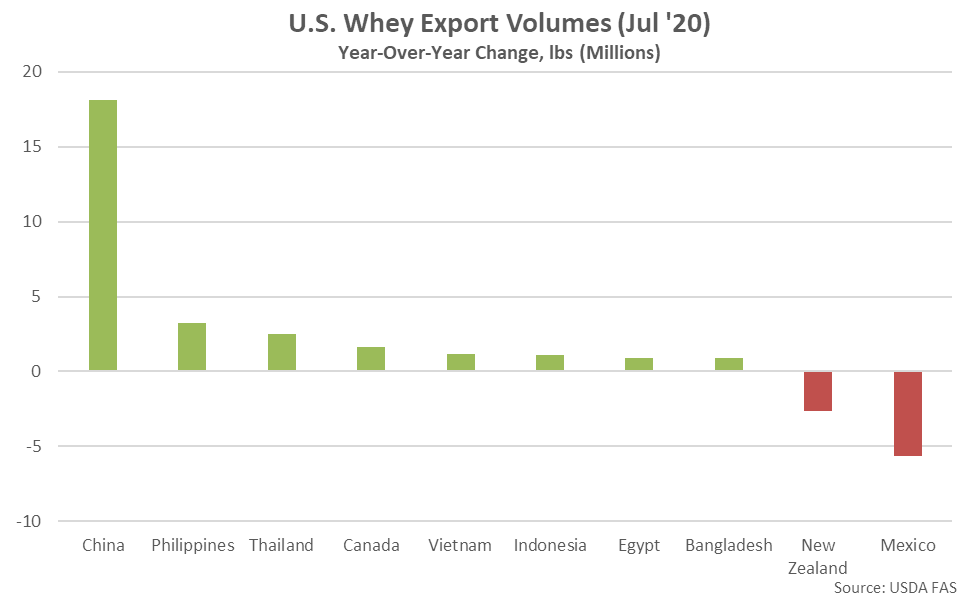 China has historically been the largest importer of U.S. whey products, accounting for over a third of the total U.S. whey export volumes throughout the past five years. U.S. whey export volumes destined to China have increased 18.1% YOY throughout the past 12 months, more than offsetting a 0.9% YOY decline in whey export volumes destined to all other countries over the same period. Chinese whey demand has rebounded of late from reduced levels stemming from weaker feed demand due to African swine fever.
 NFDM/SMP – Export Volumes Remain at a Record High Seasonal Level, Finish up 52.3% YOY
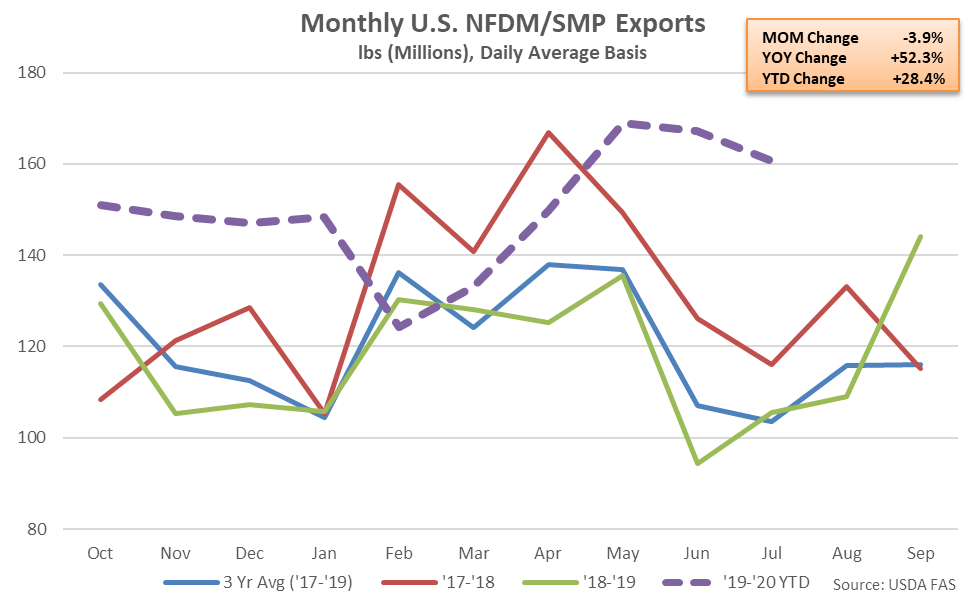
Jul ’20 U.S. export volumes of nonfat dry milk (NFDM) and skim milk powder (SMP) finished 52.3% higher on a YOY basis, reaching a record high seasonal level for the third consecutive month. The YOY increase in NFDM/SMP export volumes was the tenth experienced throughout the past 11 months.
’18-’19 annual NFDM/SMP exports declined 9.4% from the record high level experienced throughout the previous production season but remained at the second highest annual figure on record. ’19-’20 YTD NFDM/SMP export volumes have rebounded by 28.4% on a YOY basis throughout the first ten months of the production season and are on pace to reach a record high level.
NFDM/SMP – Export Volumes Remain at a Record High Seasonal Level, Finish up 52.3% YOY
Jul ’20 U.S. export volumes of nonfat dry milk (NFDM) and skim milk powder (SMP) finished 52.3% higher on a YOY basis, reaching a record high seasonal level for the third consecutive month. The YOY increase in NFDM/SMP export volumes was the tenth experienced throughout the past 11 months.
’18-’19 annual NFDM/SMP exports declined 9.4% from the record high level experienced throughout the previous production season but remained at the second highest annual figure on record. ’19-’20 YTD NFDM/SMP export volumes have rebounded by 28.4% on a YOY basis throughout the first ten months of the production season and are on pace to reach a record high level.
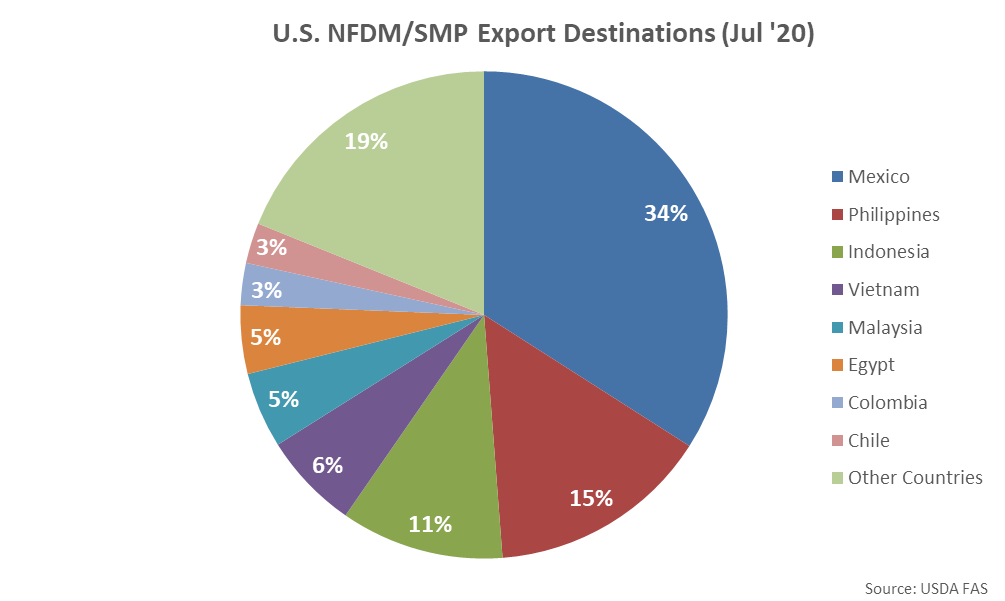
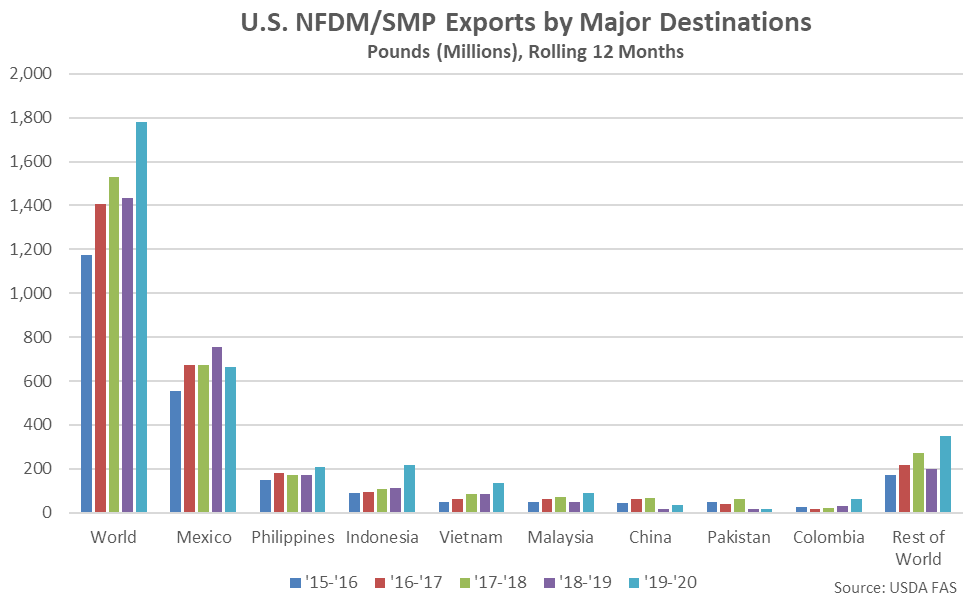
 Mexico was the top destination for U.S. NFDM/SMP export volumes throughout Jul ’20, accounting for a third of the total export volumes. Mexico, the Philippines and Indonesia combined to account for over half of the total Jul ’20 U.S. NFDM/SMP exports volumes.
 YOY increases in NFDM/SMP export volumes were led by product destined to the Philippines, followed by volumes destined to Indonesia and Egypt, while export volumes destined to Mexico finished most significantly lower on a YOY basis throughout the month.
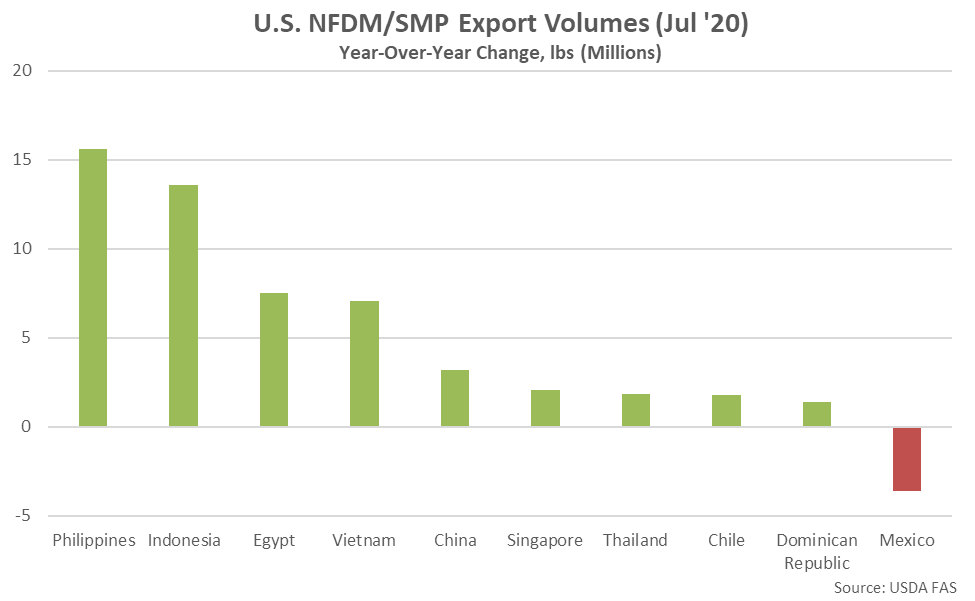 Mexico has historically been the largest importer of U.S. NFDM/SMP, accounting for over 45% of all U.S. NFDM/SMP export volumes throughout the past five years. U.S. NFDM/SMP export volumes destined to Mexico have declined 12.1% on a YOY basis throughout the past 12 months while volumes destined to all other countries have increased 64.6% YOY over the same period.
 Export Volumes Normalized to Production
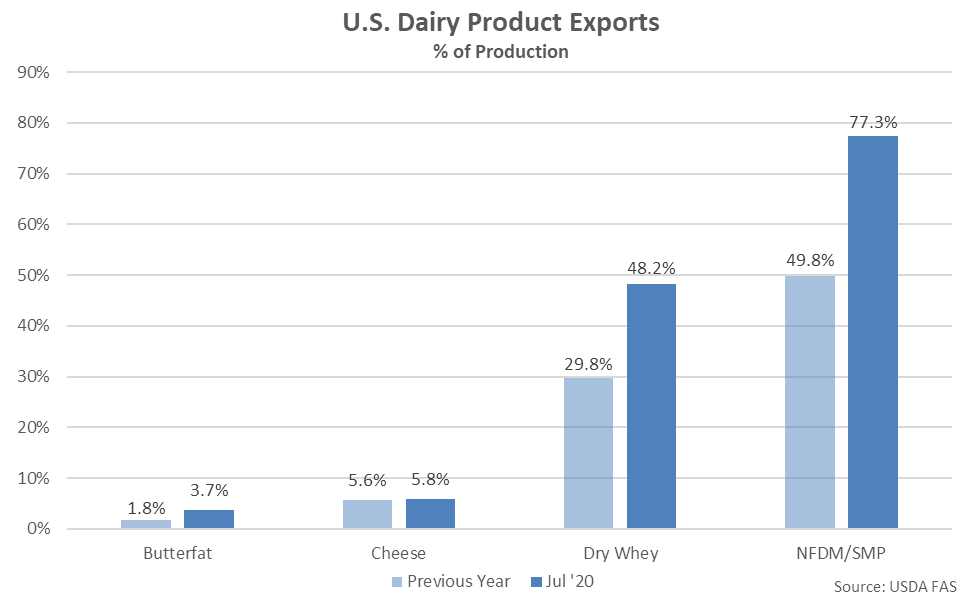
U.S. butter, cheese, dry whey and NFDM/SMP export volumes as a percentage of production all finished above previous year figures during Jul ’20. NFDM/SMP export volumes as a percentage of production increased most significantly from the previous year, followed by dry whey export volumes.
Export Volumes Normalized to Production
U.S. butter, cheese, dry whey and NFDM/SMP export volumes as a percentage of production all finished above previous year figures during Jul ’20. NFDM/SMP export volumes as a percentage of production increased most significantly from the previous year, followed by dry whey export volumes.
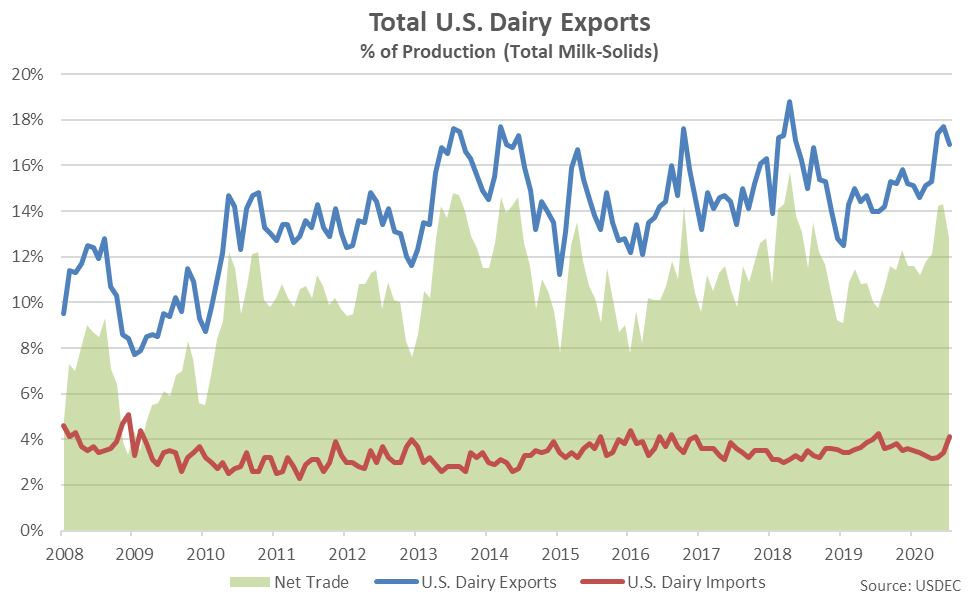
 Overall, U.S. dairy export volumes were estimated to be equivalent to approximately 16.9% of total U.S. milk-solids production during Jul ’20 while dairy import volumes were estimated to be equivalent to approximately 4.1% of total U.S. milk-solids production. Jul ’20 net dairy trade was estimated to increase 31.2% on a YOY basis, finishing higher for the ninth consecutive month. Net dairy trade had finished lower on a YOY basis over 12 consecutive months prior to increasing YOY over the nine most recent months.
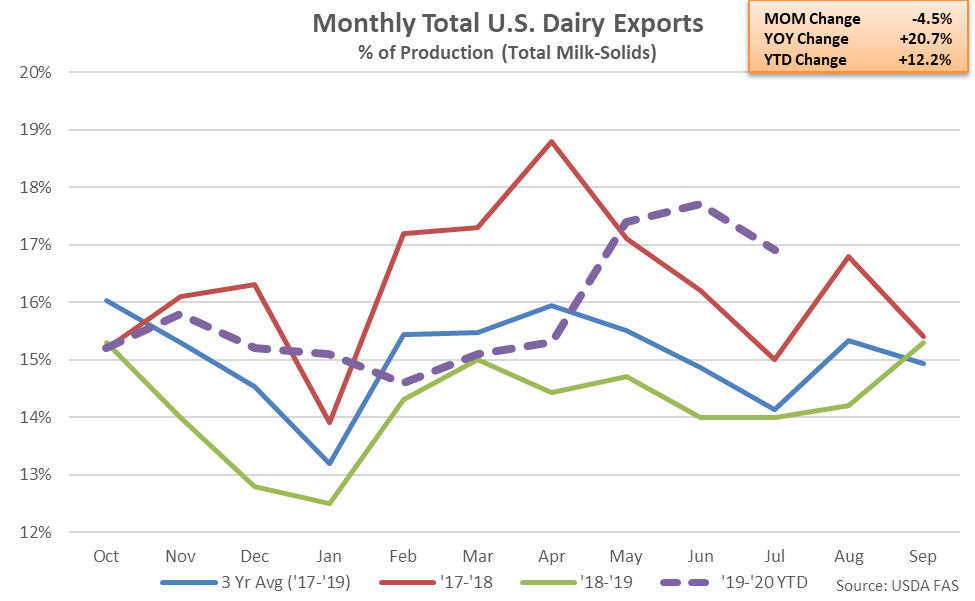
 U.S. dairy exports as a percentage of milk-solids production increased on a YOY basis for the ninth consecutive month during Jul ’20, finishing up 20.7% and reaching a seven year high seasonal level. ’18-’19 annual dairy exports as a percentage of milk-solids production declined 12.7% from the record high level experienced throughout the previous production season, finishing at a three year low, however ’19-’20 YTD figures have rebounded by 12.2% on a YOY basis throughout the first ten months of the production season.
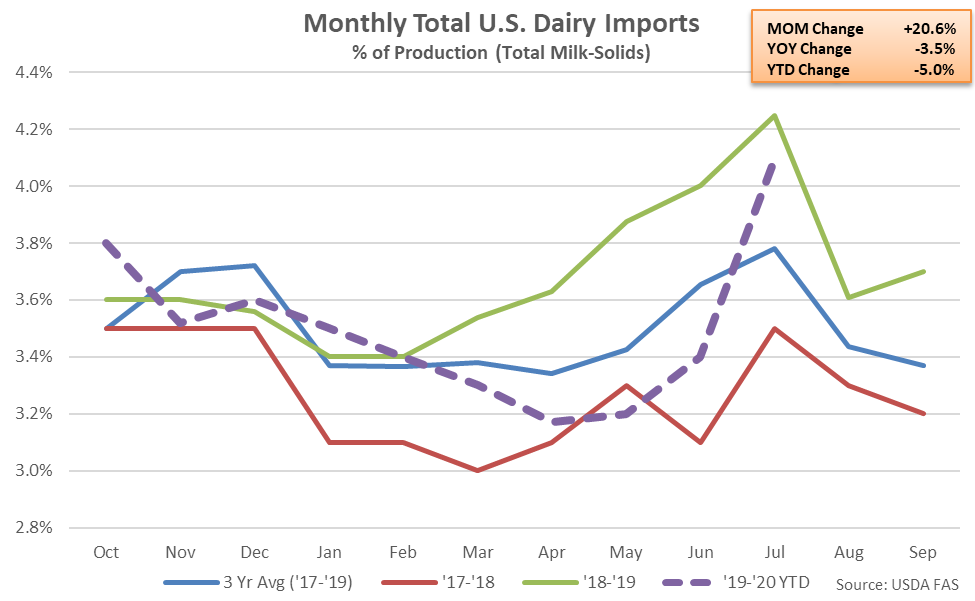
 Jul ’20 U.S. dairy imports as a percentage of milk-solids production increased seasonally from the previous month but remained 3.5% lower on a YOY basis. The YOY decline in dairy imports as a percentage of milk-solids production was the fifth experienced in a row. ’18-’19 annual dairy imports as a percentage of milk-solids production rebounded 12.7% from the four year low level experienced throughout the previous production season, reaching a three year high, however ’19-’20 YTD figures have declined 5.0% on a YOY basis throughout the first ten months of the production season.
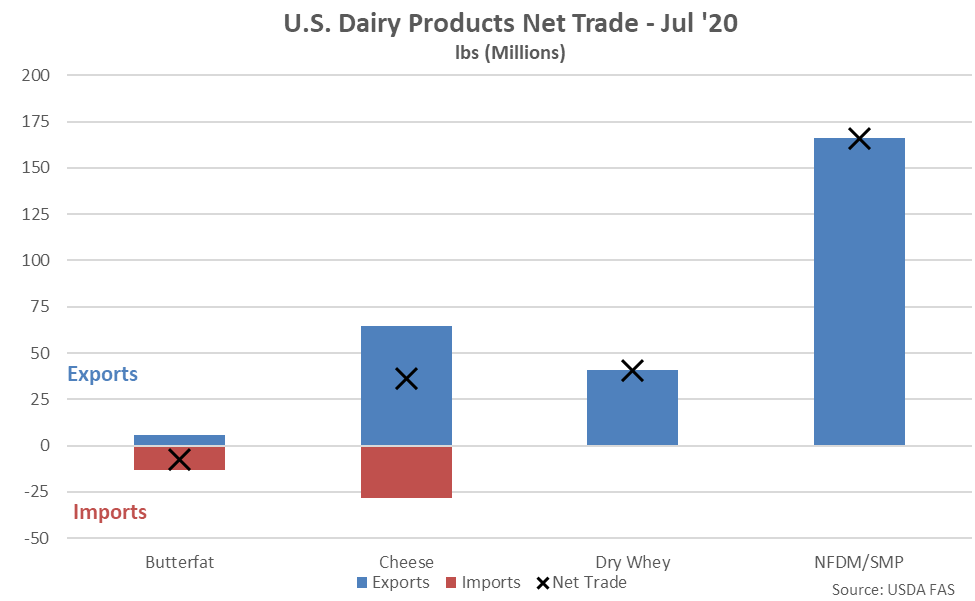
 Net trade of U.S. NFDM/SMP continued to outpace that of butter, cheese and dry whey as import volumes remain minimal. Net cheese trade volumes exceeded net dry whey trade volumes for the seventh consecutive month during Jul ’20 while the U.S. finished as a net importer of butter for the 27th consecutive month.
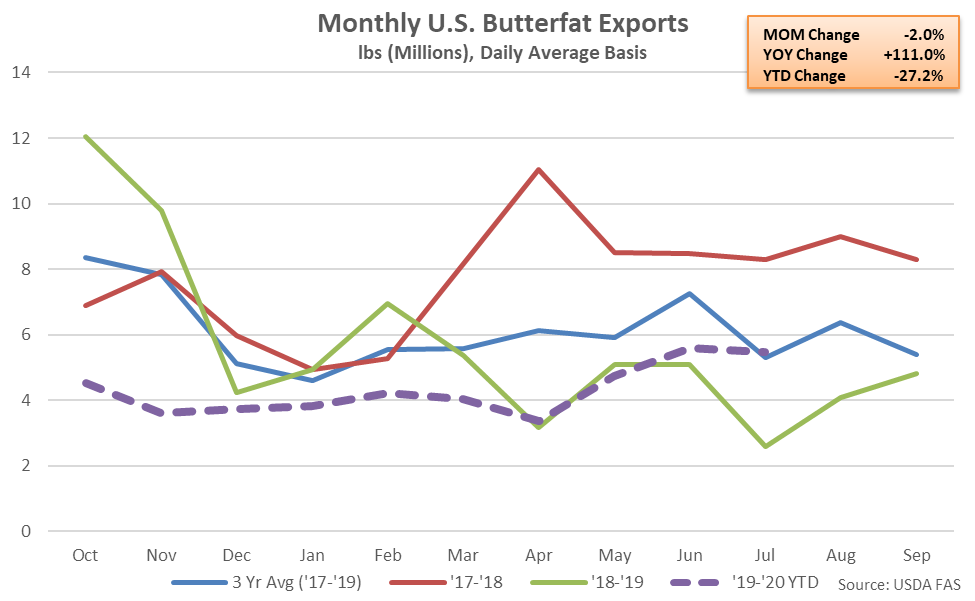
- U.S. butterfat export volumes finished 111.0% higher on a YOY basis throughout Jul ’20 however net butter trade remained at a negative level for the 27th consecutive month.
- U.S. cheese export volumes increased 5.4% on a YOY basis throughout Jul ’20, reaching a six year high seasonal level, despite cheddar cheese export volumes remaining lower on a YOY basis for the seventh time in the past eight months, declining by 10.0%. U.S. dry whey export volumes increased 65.1% on a YOY basis during Jul ’20, reaching a seven year high seasonal level, while whey protein concentrate export volumes increased 30.7% YOY throughout the month, finishing at an eight year seasonal high.
- U.S. nonfat dry milk/skim milk powder export volumes increased 52.3% on a YOY basis, remaining at a record high seasonal level for the third consecutive month.
Canada and Saudi Arabia were the top destinations for U.S. butterfat export volumes throughout Jul ’20, combining to account for over half of the total export volumes.
Butterfat export volumes destined to Saudi Arabia increased most significantly on a YOY basis throughout the month, followed by volumes destined to China and Canada, while butterfat export volumes destined to Columbia finished most significantly lower.
Canada and Mexico have historically been the largest importers of U.S. butterfat, accounting for 60% of the total U.S. export volumes experienced throughout the past five years. U.S. butterfat export volumes destined to Canada and Mexico have declined by 12.3% and 67.8%, respectively, on a YOY basis throughout the past 12 months, compared to a 14.5% YOY decline in U.S. butterfat export volumes destined to all other countries.
Cheese – Export Volumes Reach a Six Year High Seasonal Level Despite Lower Cheddar Volumes
Jul ’20 U.S. cheese export volumes declined significantly from the record high level experienced throughout the previous month but remained 5.4% higher on a YOY basis, reaching a six year high seasonal level. Other-than-cheddar cheese export volumes increased 7.9% on a YOY basis throughout the month, more than offsetting a 10.0% YOY decline in cheddar cheese export volumes. The YOY decline in cheddar cheese export volumes was the seventh experienced throughout the past eight months.
’18-’19 annual cheese export volumes increased 1.7% on a YOY basis, reaching a five year high level. ’19-’20 YTD cheese export volumes have increased an additional 1.0% on a YOY basis throughout the first ten months of the production season.
Mexico and South Korea were the top destinations for U.S. cheese export volumes throughout Jul ’20, combining to account for over half of the total export volumes.
YOY increases in cheese export volumes were led by product destined to South Korea, while volumes destined to Australia and the United Arab Emirates finished most significantly lower on a YOY basis throughout the month.
Mexico and South Korea have historically been the largest importers of U.S. cheese, accounting for nearly 45% of total U.S. cheese export volumes throughout the past five years. Combined U.S. cheese export volumes destined to Mexico and South Korea have increased 9.9% on a YOY basis throughout the past 12 months.
Whey – Dry Whey and Whey Protein Concentrate Export Volumes Each Finish Higher on a YOY Basis
U.S. dry whey export volumes increased on a YOY basis for the sixth consecutive month during Jul ’20, finishing up 65.1% and reaching a seven year high seasonal level. Dry whey export volumes had finished lower on a YOY basis over 17 consecutive months prior to the six most recently experienced YOY increases. The Jul ’20 YOY increase in dry whey export volumes was the largest experienced throughout the past 15 years on a percentage basis.
’18-’19 annual dry whey export volumes declined 30.0% from the four year high level experienced throughout the previous production season, finishing at a 15 year low level. ’19-’20 YTD dry whey export volumes have rebounded by 8.5% on a YOY basis throughout the first ten months of the production season, however.
U.S. whey protein concentrate (WPC) export volumes increased 30.7% on a YOY basis during Jul ’20, reaching an eight year high seasonal level. The YOY increase in WPC export volumes was the third experienced throughout the past four months.
’18-’19 annual WPC export volumes declined 28.9% from the record high level experienced throughout the previous production season, finishing at a four year low level. ’19-’20 YTD WPC export volumes have rebounded by 18.5% on a YOY basis throughout the first ten months of the production season.
China was the top destination for U.S. whey export volumes throughout Jul ’20, accounting for over a third of the total export volumes. China, the Philippines and Mexico combined to account for over half of the total Jul ’20 U.S. whey exports volumes.
YOY increases in whey export volumes continue to be led by product destined to China, while volumes destined to Mexico finished most significantly lower on a YOY basis throughout the month.
China has historically been the largest importer of U.S. whey products, accounting for over a third of the total U.S. whey export volumes throughout the past five years. U.S. whey export volumes destined to China have increased 18.1% YOY throughout the past 12 months, more than offsetting a 0.9% YOY decline in whey export volumes destined to all other countries over the same period. Chinese whey demand has rebounded of late from reduced levels stemming from weaker feed demand due to African swine fever.
NFDM/SMP – Export Volumes Remain at a Record High Seasonal Level, Finish up 52.3% YOY
Jul ’20 U.S. export volumes of nonfat dry milk (NFDM) and skim milk powder (SMP) finished 52.3% higher on a YOY basis, reaching a record high seasonal level for the third consecutive month. The YOY increase in NFDM/SMP export volumes was the tenth experienced throughout the past 11 months.
’18-’19 annual NFDM/SMP exports declined 9.4% from the record high level experienced throughout the previous production season but remained at the second highest annual figure on record. ’19-’20 YTD NFDM/SMP export volumes have rebounded by 28.4% on a YOY basis throughout the first ten months of the production season and are on pace to reach a record high level.
Mexico was the top destination for U.S. NFDM/SMP export volumes throughout Jul ’20, accounting for a third of the total export volumes. Mexico, the Philippines and Indonesia combined to account for over half of the total Jul ’20 U.S. NFDM/SMP exports volumes.
YOY increases in NFDM/SMP export volumes were led by product destined to the Philippines, followed by volumes destined to Indonesia and Egypt, while export volumes destined to Mexico finished most significantly lower on a YOY basis throughout the month.
Mexico has historically been the largest importer of U.S. NFDM/SMP, accounting for over 45% of all U.S. NFDM/SMP export volumes throughout the past five years. U.S. NFDM/SMP export volumes destined to Mexico have declined 12.1% on a YOY basis throughout the past 12 months while volumes destined to all other countries have increased 64.6% YOY over the same period.
Export Volumes Normalized to Production
U.S. butter, cheese, dry whey and NFDM/SMP export volumes as a percentage of production all finished above previous year figures during Jul ’20. NFDM/SMP export volumes as a percentage of production increased most significantly from the previous year, followed by dry whey export volumes.
Overall, U.S. dairy export volumes were estimated to be equivalent to approximately 16.9% of total U.S. milk-solids production during Jul ’20 while dairy import volumes were estimated to be equivalent to approximately 4.1% of total U.S. milk-solids production. Jul ’20 net dairy trade was estimated to increase 31.2% on a YOY basis, finishing higher for the ninth consecutive month. Net dairy trade had finished lower on a YOY basis over 12 consecutive months prior to increasing YOY over the nine most recent months.
U.S. dairy exports as a percentage of milk-solids production increased on a YOY basis for the ninth consecutive month during Jul ’20, finishing up 20.7% and reaching a seven year high seasonal level. ’18-’19 annual dairy exports as a percentage of milk-solids production declined 12.7% from the record high level experienced throughout the previous production season, finishing at a three year low, however ’19-’20 YTD figures have rebounded by 12.2% on a YOY basis throughout the first ten months of the production season.
Jul ’20 U.S. dairy imports as a percentage of milk-solids production increased seasonally from the previous month but remained 3.5% lower on a YOY basis. The YOY decline in dairy imports as a percentage of milk-solids production was the fifth experienced in a row. ’18-’19 annual dairy imports as a percentage of milk-solids production rebounded 12.7% from the four year low level experienced throughout the previous production season, reaching a three year high, however ’19-’20 YTD figures have declined 5.0% on a YOY basis throughout the first ten months of the production season.
Net trade of U.S. NFDM/SMP continued to outpace that of butter, cheese and dry whey as import volumes remain minimal. Net cheese trade volumes exceeded net dry whey trade volumes for the seventh consecutive month during Jul ’20 while the U.S. finished as a net importer of butter for the 27th consecutive month.