U.S. Licensed Dairy Herds Update – Feb ’21
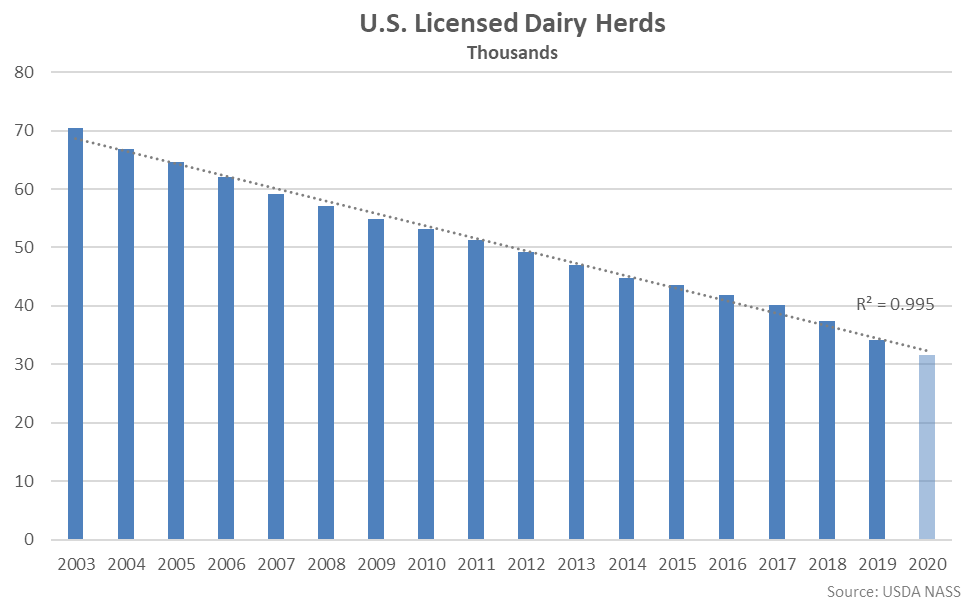
According to the USDA, the number of U.S. licensed dairy herds continued to decline throughout 2020, reaching the lowest annual figure on record. Licensed dairy herd figures have declined linearly since the data series began in 2003.
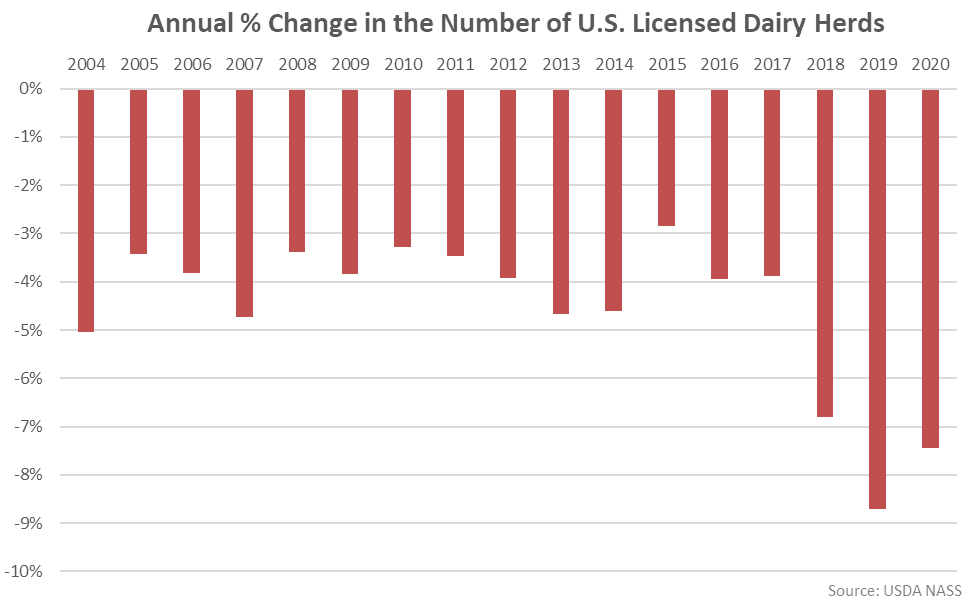
The total number of licensed dairy herds declined by 2,550, or 7.5%, throughout 2020. On a percentage basis, the 2020 decline in licensed dairy herds was the second largest experienced on record, trailing only the previous year figure.
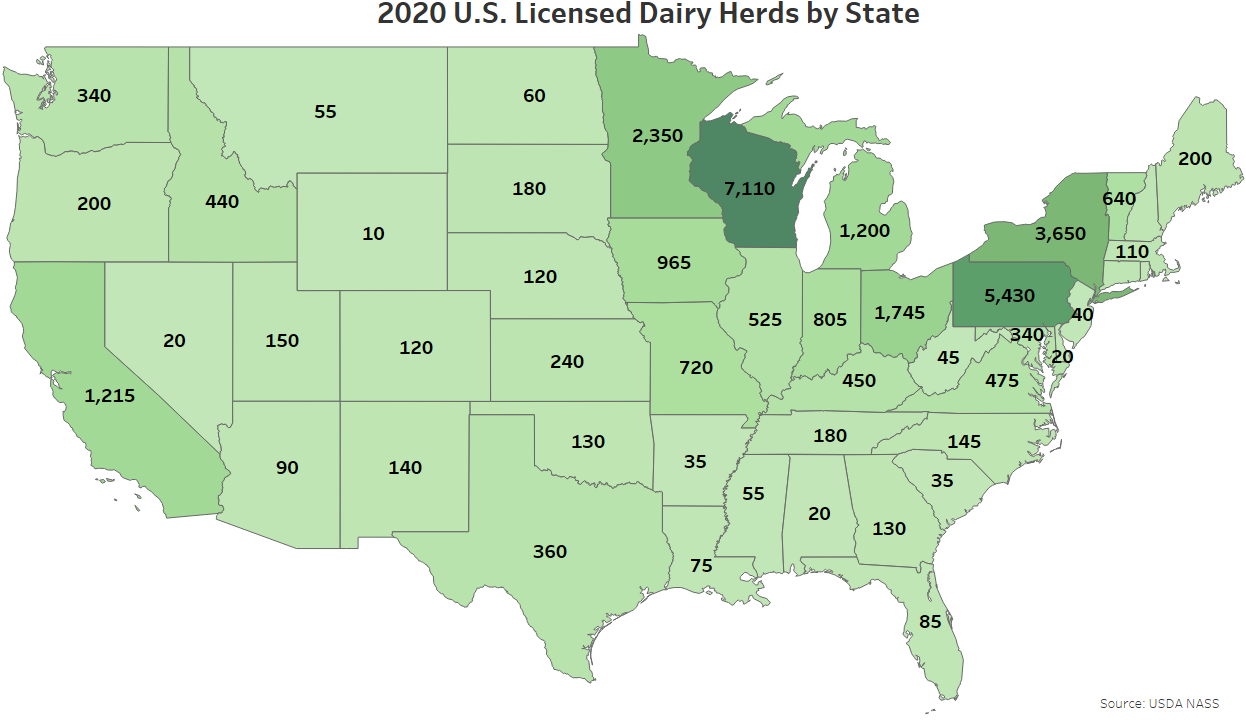
Wisconsin had the largest number of licensed dairy herds throughout 2020, followed by Pennsylvania and New York. The aforementioned states combined to account for over half of the total U.S. licensed dairy herds throughout the year.
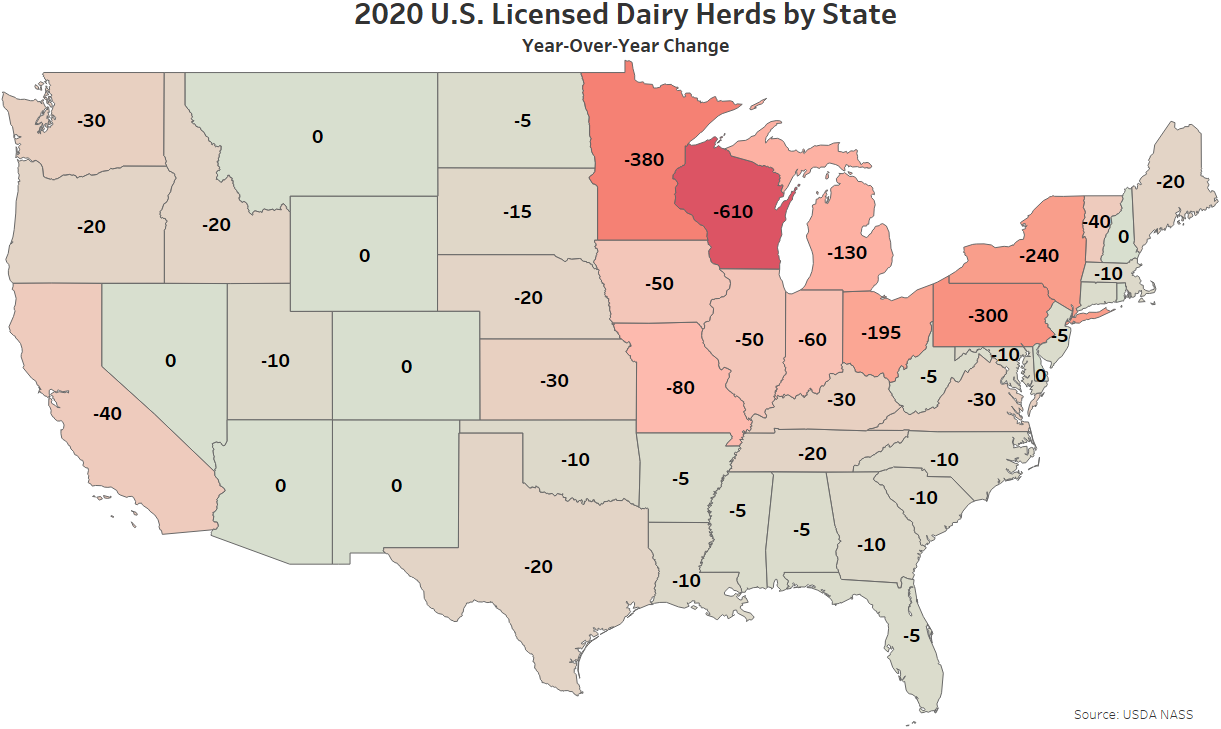
YOY declines in licensed dairy herds were most significant on an absolute basis throughout Wisconsin, followed by Minnesota and Pennsylvania. Wisconsin accounted for nearly a quarter of the total YOY decline in licensed dairy herds experienced throughout 2020. No state experienced a YOY increase in the number of licensed dairy herds throughout 2020.
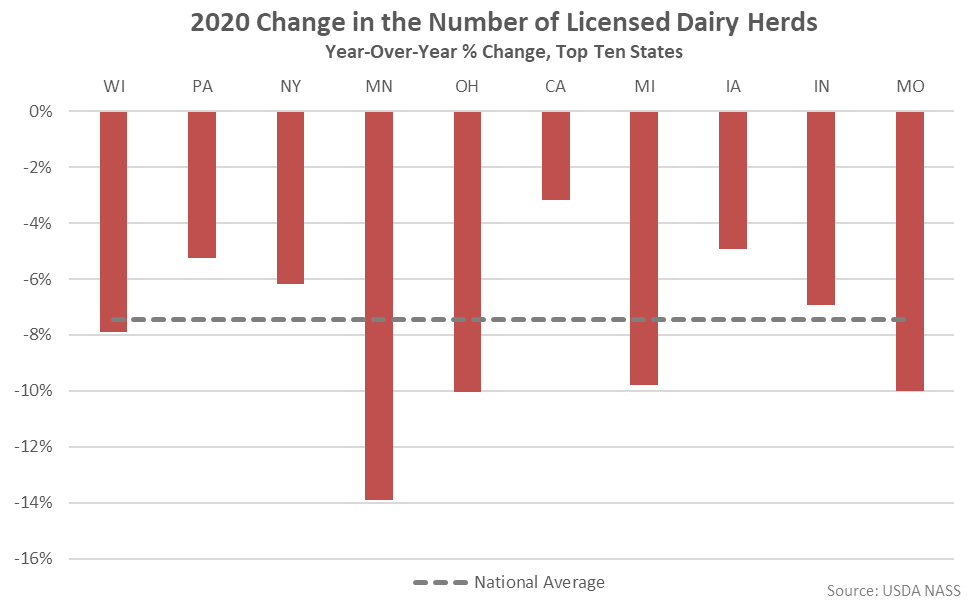
Of the states with the ten largest number of licensed dairy herds, YOY declines on a percentage basis were most significant throughout Minnesota (-13.9%), followed by Ohio (-10.1%), Missouri (-10.0%) and Michigan (-9.8%).
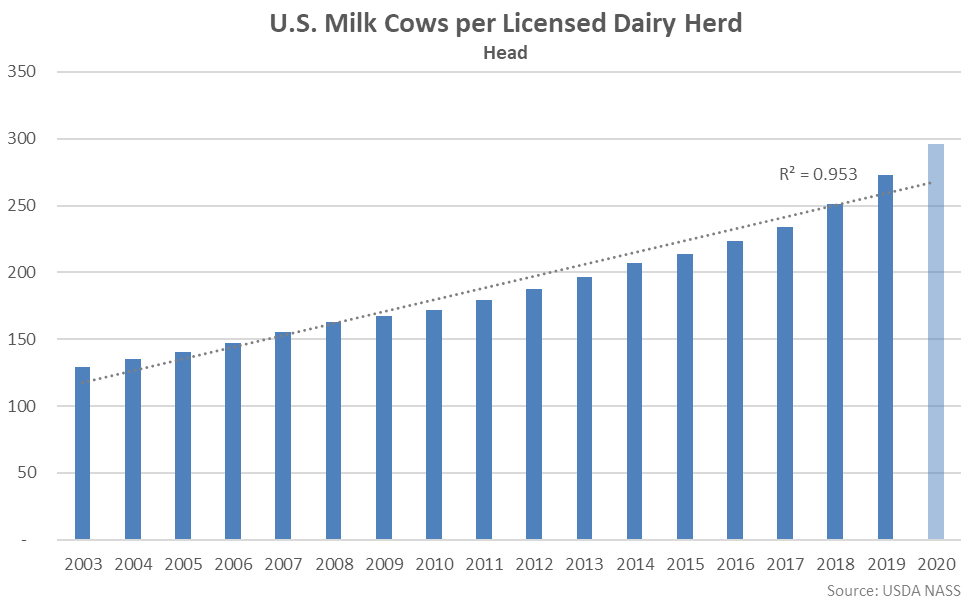
The number of milk cows per licensed dairy herd continued to increase throughout 2020, reaching a record high level of 297 cows per herd. The number of milk cows per licensed dairy herd have increased at record high levels over the past two years.
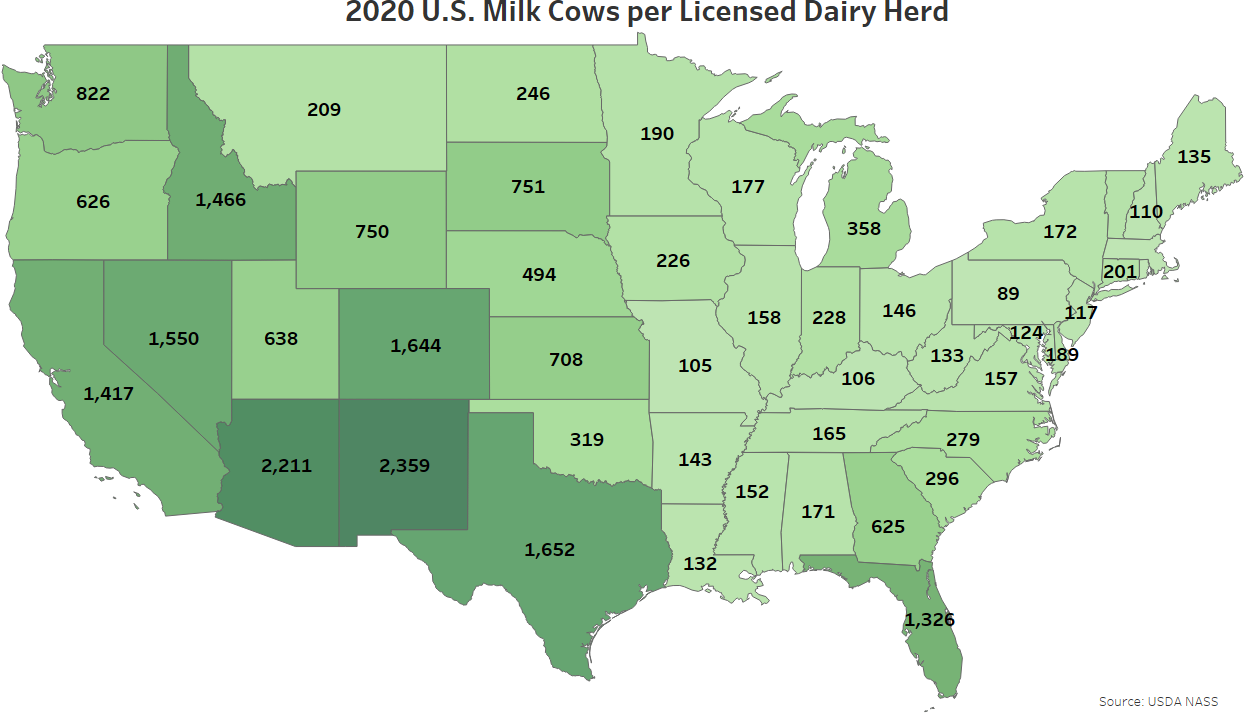
New Mexico had the largest number of milk cows per licensed dairy herd throughout 2020, followed by Arizona, Texas and Colorado.
