U.S. Per Capita Dairy Consumption Update – Feb ’22
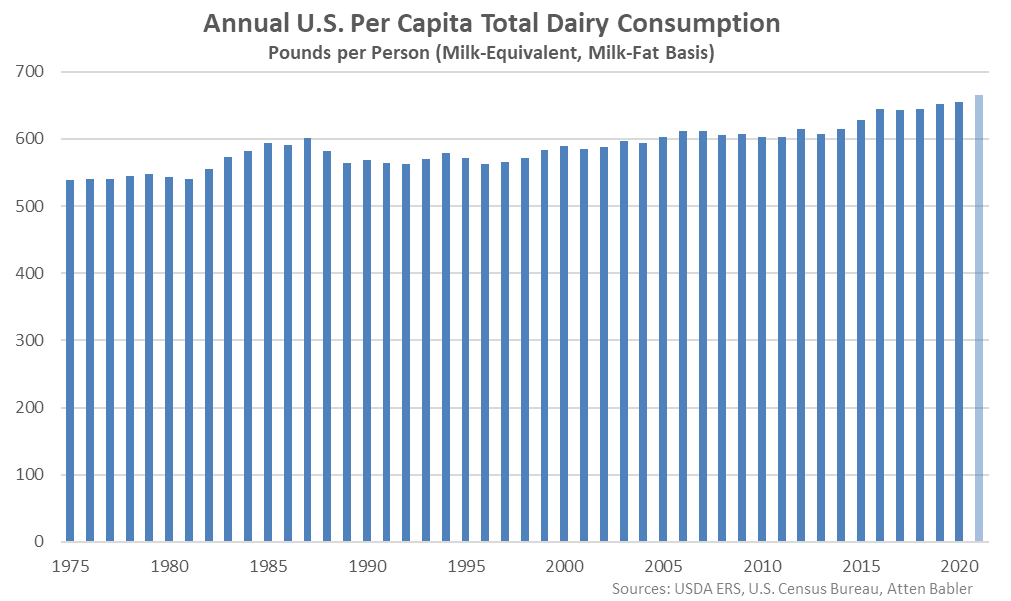
Domestic per capita consumption of dairy products on a milk-equivalent, milk-fat basis increased 1.5% on a YOY basis throughout 2021, reaching a record high level for the third consecutive year. The YOY increase in per capita dairy consumption rates was the seventh experienced throughout the past eight years and the largest experienced throughout the past five years.
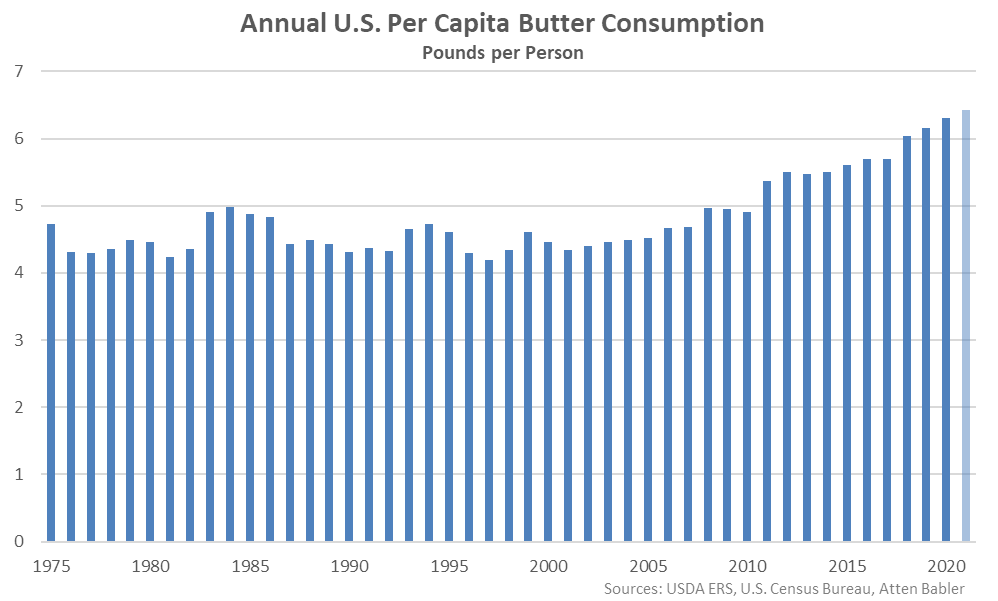
Domestic per capita butter consumption reached a record high level throughout 2021, finishing 2.0% above previous year levels. Butter consumption increased to 6.4 pounds per person throughout 2021, reaching a record high level for the fourth consecutive year.
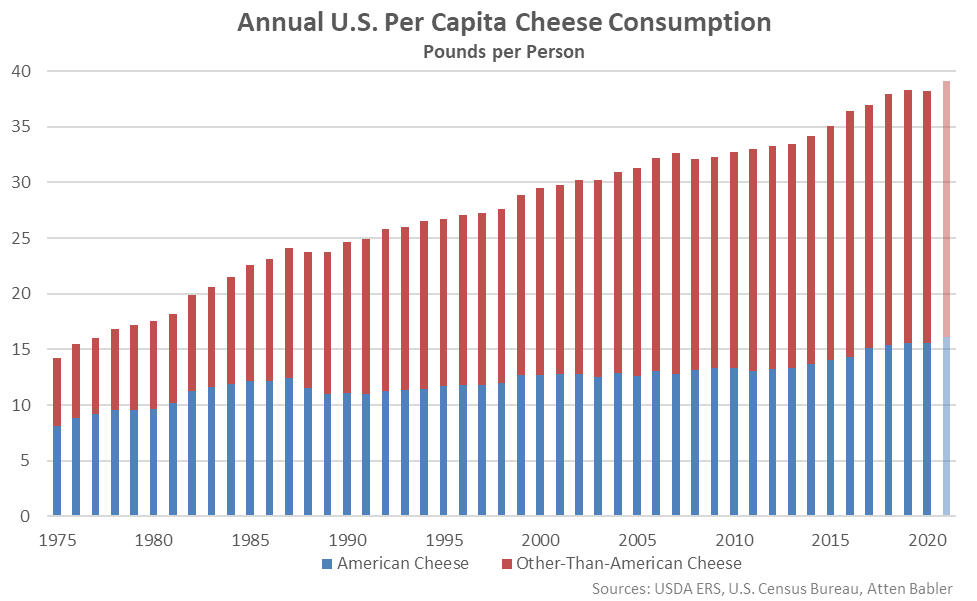
2021 domestic per capita cheese consumption also reached a record high level throughout 2021, finishing 2.3% above previous year levels. Cheese consumption increased to 39.1 pounds per person throughout 2021, reaching a record high level for the 12th time in the past 13 years. Per capita American cheese consumption increased 3.1% on a YOY basis throughout the year, while per capita other-than-American cheese consumption finished 1.8% above previous year figures.
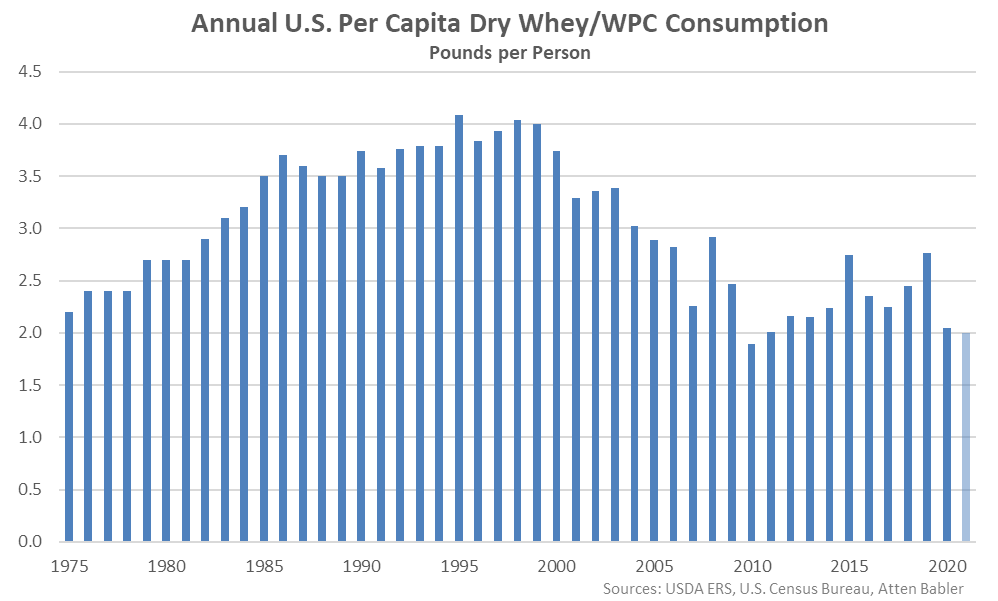
Domestic per capita dry whey and whey protein concentrate consumption declined to an 11 year low level throughout 2021, finishing 2.6% below previous year figures. Dry whey and whey protein concentrate consumption declined to 2.0 pounds per person throughout 2021.
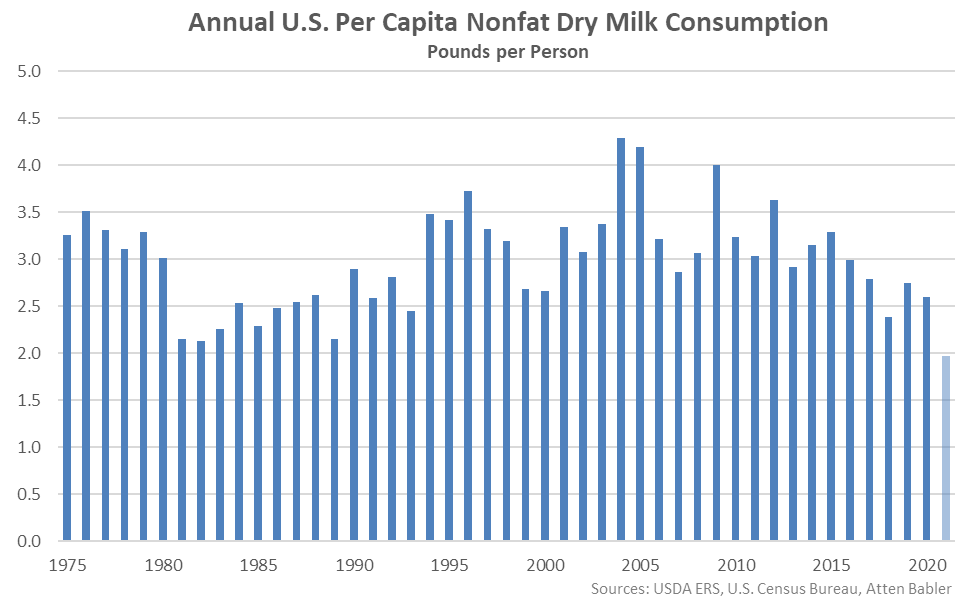
Domestic per capita nonfat dry milk consumption declined to a record low level throughout 2021, finishing 24.3% below previous year figures. Nonfat dry milk consumption declined to 2.0 pounds per person throughout 2021, finishing below the previous record low level of 2.1 pounds per person experienced throughout 1982. Per capita nonfat dry milk consumption figures have been compiled since 1975.
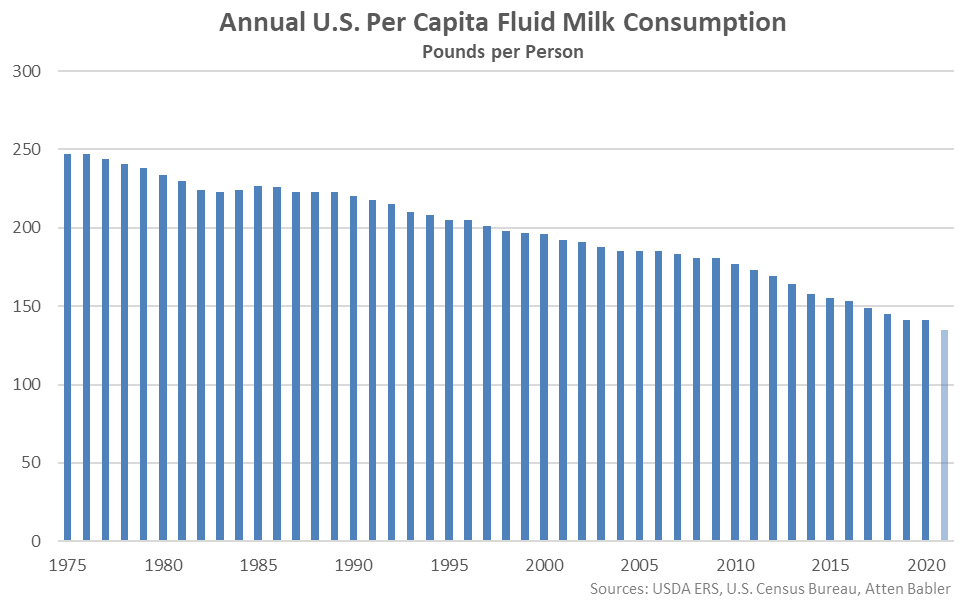
Domestic per capita fluid milk consumption declined 4.2% on a YOY basis throughout 2021, also reaching the lowest level on record. Fluid milk consumption declined to 135 pounds per person throughout 2021, finishing flat or below previous year levels for the 36th consecutive year.
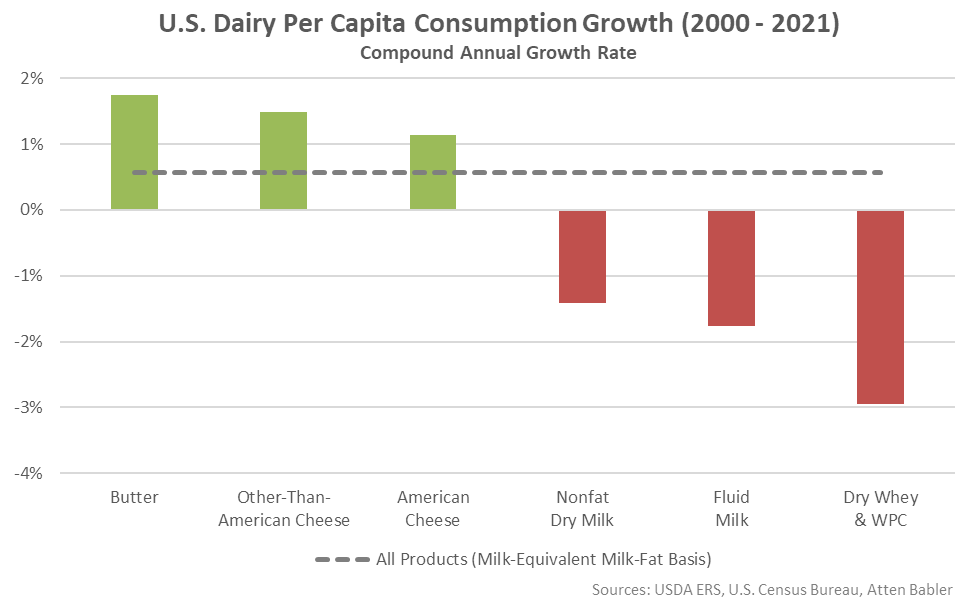
Since 2000, total U.S. per capita consumption of dairy products on a milk-equivalent, milk-fat basis has increased by a compound annual growth rate of 0.6%. Per capita butter consumption has increased most significantly throughout the period, followed by per capita cheese consumption, while per capita dry whey/whey protein concentrate, fluid milk, and nonfat dry milk consumption all declined over the period.
